Key risk events today:
Limited.
(Previous analysis as well as outside sources – italics).
EUR/USD:
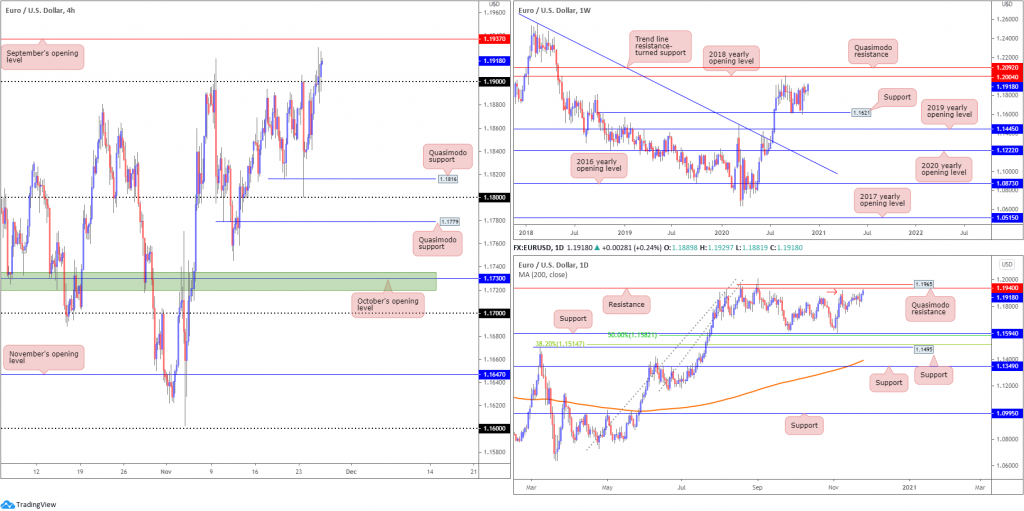
Wednesday witnessed the euro capitalise on dollar weakness, recently probing fresh monthly peaks at 1.1929.
H4 movement retested, and held, the 1.19 handle as support, shining the spotlight on September’s opening value at 1.1937.
Meanwhile, the weekly timeframe shows buyers making their way towards the 2018 yearly opening value at 1.2004, closely shadowed by Quasimodo resistance priced at 1.2092. The daily timeframe is also poised to test resistance at 1.1940, followed by Quasimodo resistance from 1.1965.
Areas of consideration:
- Breakout buyers north of 1.19 on the H4 are likely targeting September’s opening value at 1.1937.
- September’s opening value on the H4 and daily resistance at 1.1940 marks healthy (resistance) confluence to work with.
- Weekly resistance, in the shape of the 2018 yearly opening value, at 1.2004 joins closely with the key figure 1.20 on the H4, consequently representing strong resistance.
GBP/USD:
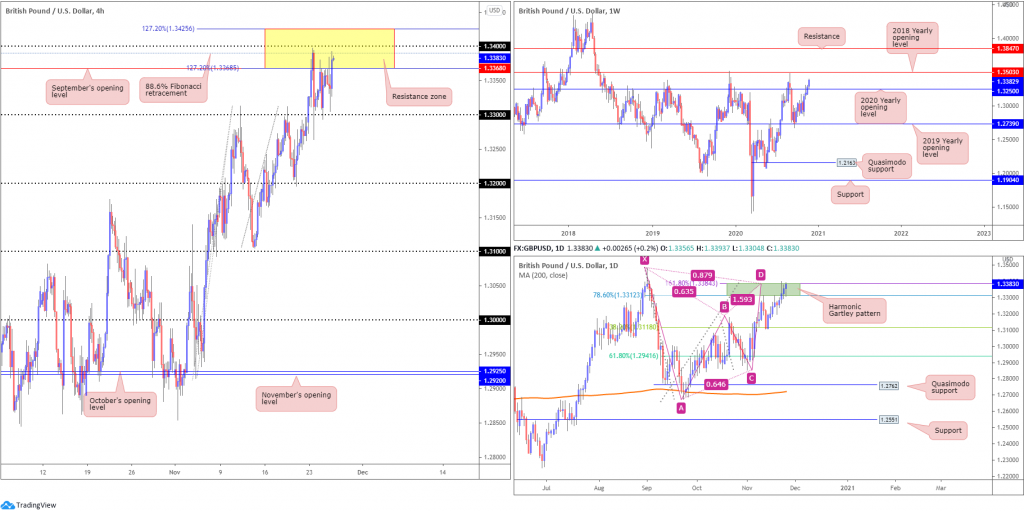
Largely overlooking the lack of Brexit developments and UK Chancellor Sunak’s spending review, GBP/USD buyers went on the offensive Wednesday.
Technically, H4 remains supported above the 1.33 point, recording a fourth consecutive daily advance. H4 is also still dealing with familiar resistance (yellow) between 1.3425/1.3368 (made up of two 127.2% Fibonacci projection points at 1.3425/1.3368, the round number 1.34, an 88.6% Fibonacci retracement ratio at 1.3390 and September’s opening value at 1.3368).
From the weekly timeframe, after rejecting the 2019 yearly opening value from 1.2739 in September, buyers eventually mustered enough strength to take on the 2020 yearly opening value at 1.3250 last week and record a third consecutive weekly gain. Additional strength could have the unit knock on the door of the 2018 yearly opening value from 1.3503. Technically, however, the immediate trend has remained lower since topping in 2014.
Elsewhere, the daily picture, thanks to recent upside, is seen squeezing sellers within the bearish harmonic Gartley pattern’s PRZ at 1.3384/1.3312. Overthrowing the aforementioned PRZ could be viewed as an early cue we’re headed for the 2018 yearly opening value at 1.3503 on the weekly scale.
Areas of consideration:
- Weekly buyers targeting 1.3503 and daily sellers under pressure within the bearish harmonic Gartley pattern’s PRZ at 1.3384/1.3312, positions H4 sellers out of the resistance zone from 1.3425/1.3368 in a vulnerable position.
- Bullish scenarios, in light of the above analysis, may be found off the 1.33 region (in the event of a correction) or north of the 1.34 handle (H4).
AUD/USD:
The Australian dollar finished the European session considerably off worst levels against the buck on Wednesday. Ultimately, though, little change has been seen from a technical perspective. As such, here’s a reminder of where we left yesterday’s outlook.
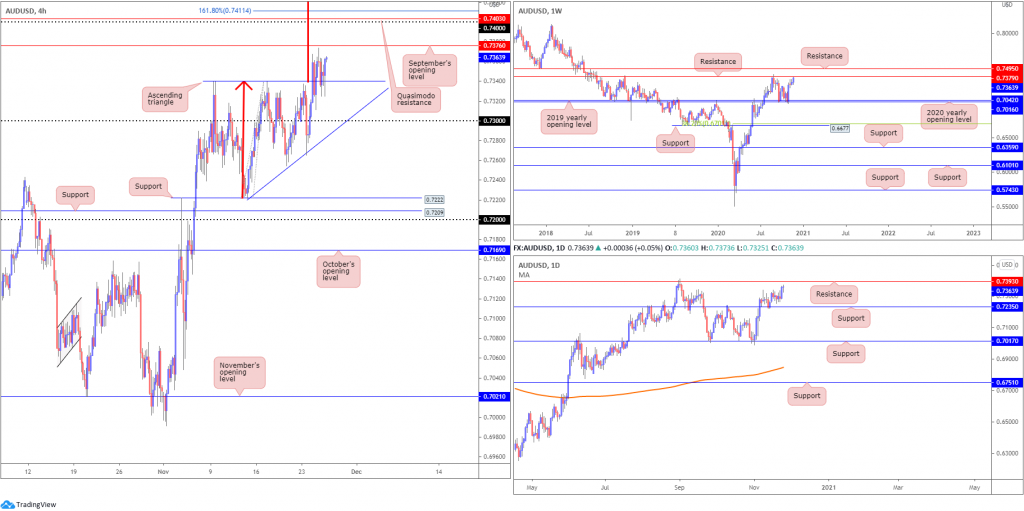
Recent action breached the top side of a H4 ascending triangle pattern (0.7340). This projects a possible target of around 0.7544 (red arrows), implying a break above September’s opening value at 0.7376, the 0.74 handle and Quasimodo resistance at 0.7403.
Buyers, based on the weekly timeframe, are seen extending the 3% showing off the 2020 (0.7016) and 2019 (0.7042) yearly opening values (supports) formed early November, positioning the unit within striking distance of resistance at 0.7379. In view of this market trending higher since early 2020, buyers may also be eyeballing resistance parked at 0.7495.
Following the November 13 retest of support at 0.7235, despite a somewhat lacklustre performance last week, buyers have eventually found some grip and shined the spotlight on resistance at 0.7393 (positioned above weekly resistance).
Areas of consideration:
- Breakout buyers above the H4 ascending triangle have an ultimate target of 0.7544, though could have problems with resistances nearby (see below).
- September’s opening value at 0.7376, weekly resistance at 0.7379 and daily resistance at 0.7393 form an area of resistance to be mindful of.
- 74 on the H4, along with Quasimodo resistance at 0.7403 and a 127.2% Fibonacci projection point at 0.7411 is also an area to be aware of.
USD/JPY:
Modestly lower on the day, USD/JPY struggled to find demand on Wednesday as the DXY piled into fresh monthly lows.
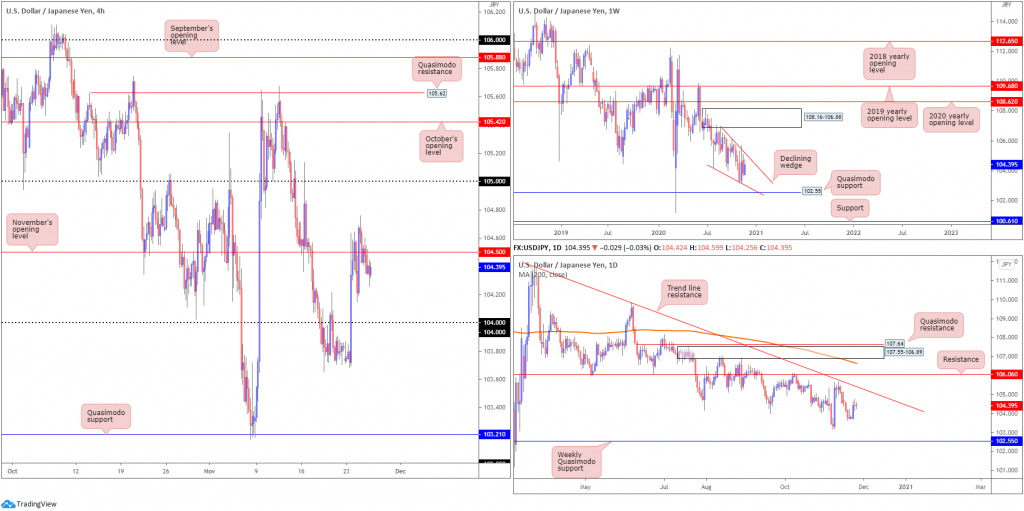
Heading into Thursday’s session, H4 is seen holding south of November’s opening value at 104.50 after failing to find acceptance north of the latter on Wednesday. 104 demands attention should sellers remain in the driving seat, with a break exposing 103.70 lows.
Higher timeframes unchanged:
Weekly price, since connecting with the underside of supply at 108.16-106.88 in August, has gradually shifted lower and developed a declining wedge (106.94/104.18). Quasimodo support at 102.55 is in the picture, with a break exposing support plotted at 100.61. A strong bounce from 102.55 may provide enough impetus for buyers to attempt a breakout above the current declining wedge.
The technical landscape from the daily timeframe, however, reveals scope to close in on trend line resistance, extended from the high 111.71, with a break to perhaps take a run at resistance from 106.06. Nevertheless, sellers taking over could lead price to the 103.17 November 6 low, followed by weekly Quasimodo support at 102.55. The only noteworthy addition on this timeframe is the back-to-back indecision doji candles recently formed.
Areas of consideration:
- Retesting 104.50 on the H4 scale today as resistance may be a platform sellers show interest in, targeting at least 104.
USD/CAD:
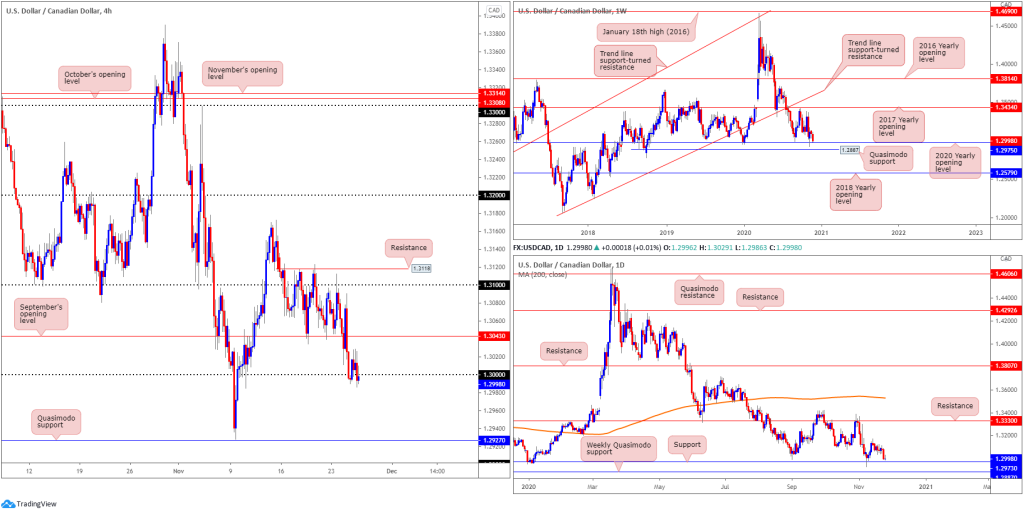
USD/CAD prices finished mostly unmoved Wednesday, with H4 action attempting to negotiate direction around the key figure 1.30. Buying interest off the round number was hampered by 1.3020 yesterday, indicating sellers may try to knock price south of 1.30 today, in hope of reaching Quasimodo support at 1.2927.
However, before reaching for the aforementioned H4 Quasimodo, as underlined in yesterday’s technical briefing, traders might want to take into account weekly support resides close by in the form of a 2020 yearly opening value at 1.2975, as well as daily support coming in at 1.2973 (essentially marking the same region).
Areas of consideration:
- Given 1.30 is a widely watched figure, buyers are unlikely to give up this level without a fight.
- A fakeout through 1.30 to welcome buyers off weekly/daily supports at 1.2975ish could arise. A reaction off higher timeframe supports, fuelled on sell-stop liquidity (from under 1.30), may see buyers close back above 1.30, a move that might attract additional buyers back to September’s opening value at 1.3043 (H4).
USD/CHF:
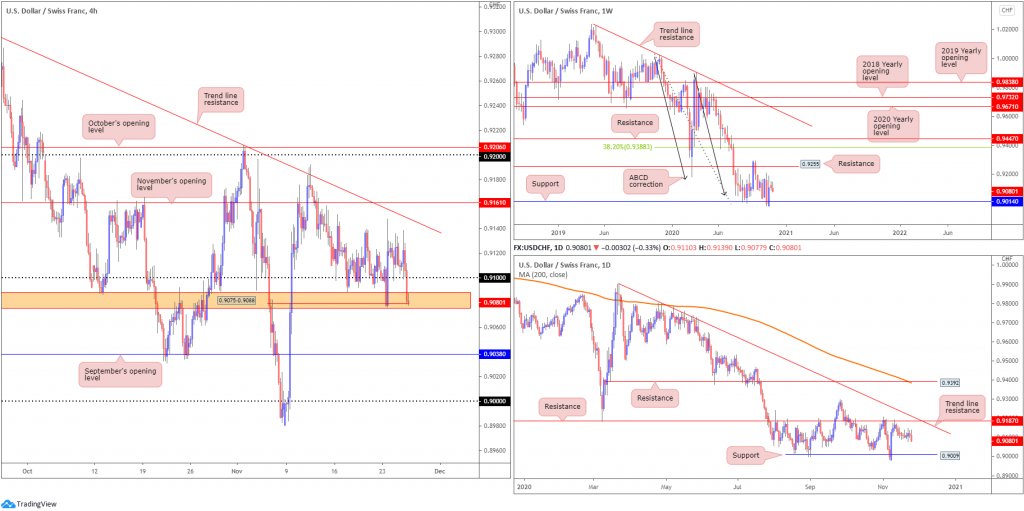
The safe-haven Swiss franc latched on to a mild bid Wednesday amidst risk aversion. Leaving trend line resistance, extended from the high 0.9295, and November’s opening value at 0.9161 unchallenged, this escorted USD/CHF back through the 0.91 handle on the H4 into a familiar area of support from 0.9075-0.9088 (orange) and consequently tested 0.9079 (a clear H1 Quasimodo resistance-turned support). Beyond 0.9075-0.9088, bearish themes could develop towards September’s opening value at 0.9038, followed by the key 0.90 level.
Action on the higher timeframes currently offers little in terms of technical structure.
Weekly price is seen lingering mid-way between support at 0.9014, a level dovetailing closely with ABCD support at 0.9051 (black arrows), and 0.9255 resistance (a prior Quasimodo support). It should also be noted this market has been trending lower since April 2019, seen clearly from the weekly scale.
From the daily timeframe, price remains languishing south of resistance at 0.9187, with Quasimodo support at 0.9009 representing a possible downside objective on this chart. It’s also worth acknowledging trend line resistance resides close by, taken from the high 0.9901.
Areas of consideration:
- 9075-0.9088 is a grounded area of support on the H4 scale, though given the force sellers entered the zone a break lower is perhaps in the offing, a move that could trigger further weakness to at least September’s opening value at 0.9038 (H4).
- Buyers making a stand out of 0.9075-0.9088 may see additional buyers join following a H4 close back above 0.91.
Dow Jones Industrial Average:
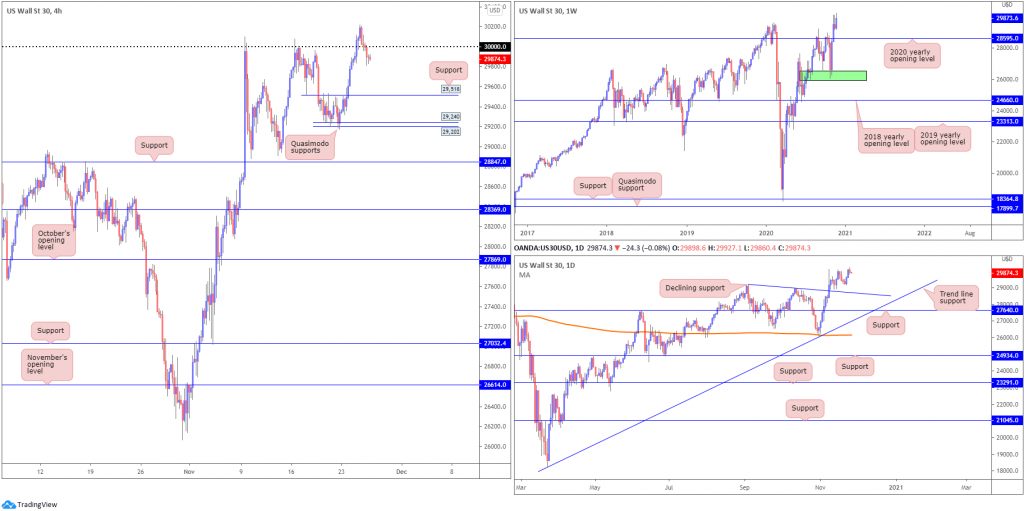
US equity benchmarks finished mixed Wednesday amid less-than-stellar US data. The Dow Jones Industrial Average shed 173.77 points, or 0.58%; the S&P 500 traded lower by 5.76 points, or 0.16%, while the Nasdaq ended higher by 57.08 points, or 0.47%.
Buyers, based on the H4 scale, failed to find approval above the widely watched 30,000 figure on Wednesday, dipping from all-time peaks at 30,217 and establishing what many technicians will view as an early bull trap. H4 support at 29,518 is in sight, while digging beyond may have sellers make their way towards two Quasimodo supports at 29,202 and 29,240.
Meanwhile, on the bigger picture, weekly support is not expected to make an appearance until around the 2020 yearly opening value at 28,595. Similarly, declining support on the daily timeframe, taken from the high 29,193, also offers support around the 28,595ish area.
Areas of consideration:
- For many, this will be a difficult unit to sell sub 30,000, having recently witnessed fresh all-time highs.
- Dip-buyers are likely watching H4 support at 29,518 and the two Quasimodo supports at 29,202 and 29,240.
- Crossing back above 30,000, on the other hand, could ignite breakout strategies.
XAU/USD (GOLD):
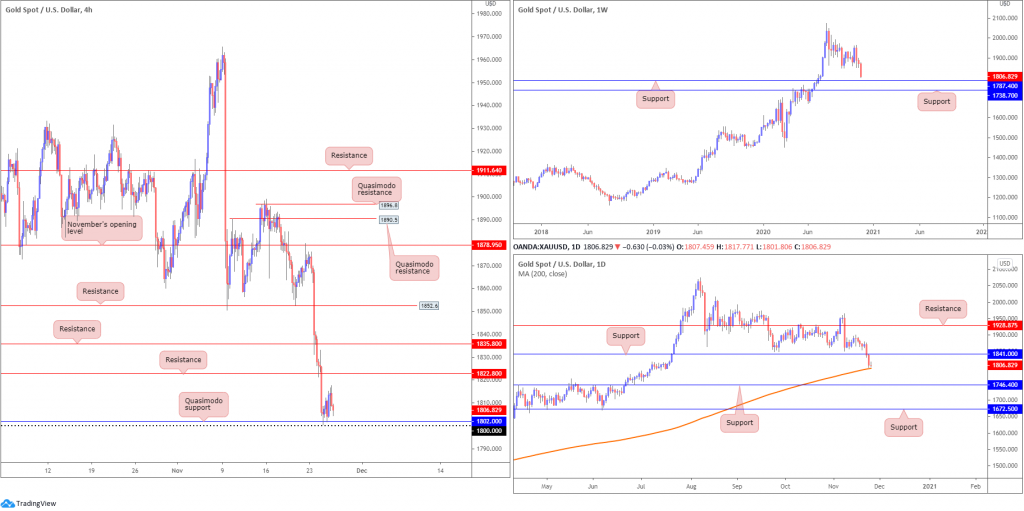
It was a slow day for the yellow metal Wednesday, modestly buoyed north of the $1,800 level and a H4 Quasimodo support at $1,802.
As described in Wednesday’s technical briefing, H4 buyers may struggle to find a foothold off $1,800 as daily action reveals a possible fakeout through $1,800 into the 200-day SMA (orange – $1,797). Traders may also acknowledge weekly price suggests an extension to the downside towards support coming in at $1,787.
Areas of consideration:
- H4 whipsawing through $1,800 to test the 200-day SMA on the daily timeframe at $1,797 is a possible scenario. Buyers defending the SMA and printing a H4 close back above $1,800 may invite additional buyers into the fight.
- Holding south of $1,800, on the other hand, could fuel continuation selling towards weekly support at $1.787.
The accuracy, completeness and timeliness of the information contained on this site cannot be guaranteed. IC Markets does not warranty, guarantee or make any representations, or assume any liability regarding financial results based on the use of the information in the site.
News, views, opinions, recommendations and other information obtained from sources outside of www.icmarkets.com.au, used in this site are believed to be reliable, but we cannot guarantee their accuracy or completeness. All such information is subject to change at any time without notice. IC Markets assumes no responsibility for the content of any linked site.
The fact that such links may exist does not indicate approval or endorsement of any material contained on any linked site. IC Markets is not liable for any harm caused by the transmission, through accessing the services or information on this site, of a computer virus, or other computer code or programming device that might be used to access, delete, damage, disable, disrupt or otherwise impede in any manner, the operation of the site or of any user’s software, hardware, data or property

