A note on lower timeframe confirming price action…
Waiting for lower timeframe confirmation is our main tool to confirm strength within higher timeframe zones, and has really been the key to our trading success. It takes a little time to understand the subtle nuances, however, as each trade is never the same, but once you master the rhythm so to speak, you will be saved from countless unnecessary losing trades. The following is a list of what we look for:
- A break/retest of supply or demand dependent on which way you’re trading.
- A trendline break/retest.
- Buying/selling tails/wicks – essentially we look for a cluster of very obvious spikes off of lower timeframe support and resistance levels within the higher timeframe zone.
- Candlestick patterns. We tend to stick with pin bars and engulfing bars as these have proven to be the most effective.
We search for lower timeframe confirmation between the M15 and H1 timeframes, since most of our higher-timeframe areas begin with the H4. Stops are usually placed 5-10 pips beyond confirming structures.
EUR/USD:
(Trade update: took a small loss on our short from 1.0887)
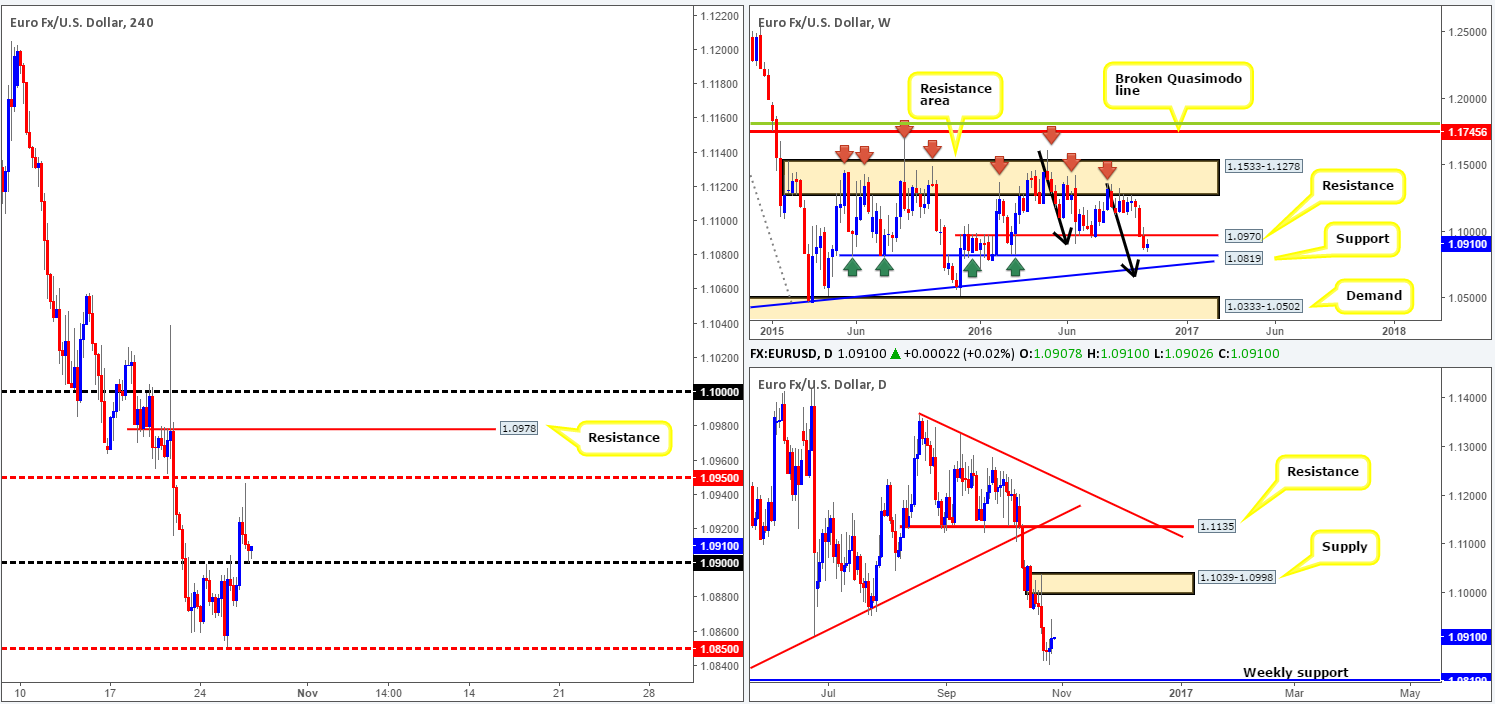
Despite the bounce seen from the underside of the 1.09 handle, the EUR/USD traded as high as 1.0946 during the course of yesterday’s sessions, before leveling off and retesting 1.09 as support going into the close. To our way of seeing things, this recent bout of buying was simply due to dollar weakness seen against the majority of its trading peers (see the US dollar index).
Technically speaking, the shared currency could continue to press north from here and retest the weekly resistance level at 1.0970, which happens to be positioned eight pips below a H4 resistance at 1.0978 and sits just below a daily supply drawn from 1.1039-1.0998. However, we firmly believe that even if price does rally north to shake hands with the above said structures that the unit will eventually to connect with weekly support at 1.0819, and possibly a little lower.
Our suggestions: On account of the above points, 1.09 is key for our desk today. A decisive push below could portend further downside towards the H4 mid-way support 1.0850, and possibly the weekly support mentioned above at 1.0819. Conversely, should the bulls continue to defend 1.09, the H4 mid-way resistance 1.0950 will likely be the next objective to reach, followed by 1.0978: the H4 resistance mentioned above. To trade below 1.09, waiting for a retest to the underside of the line along with a H4 bearish close is recommended. Similarly, if you’re looking to trade above this number, we’d advise waiting for lower timeframe confirming price action before pulling the trigger: either an engulf of supply followed by a retest, a trendline break/retest or simply a collection of well-defined buying tails.
On the calendar today, the docket contains US Durable goods data at 12.30pm, along with the US weekly jobless claims report also released at 12.30pm GMT.
Levels to watch/live orders:
- Buys: 1.09 region ([lower timeframe confirmation required] Stop loss: dependent on where one confirms this area).
- Sells: Watch for a close below 1.09 and then look to trade any retest seen thereafter (H4 bearish close required).
GBP/USD:
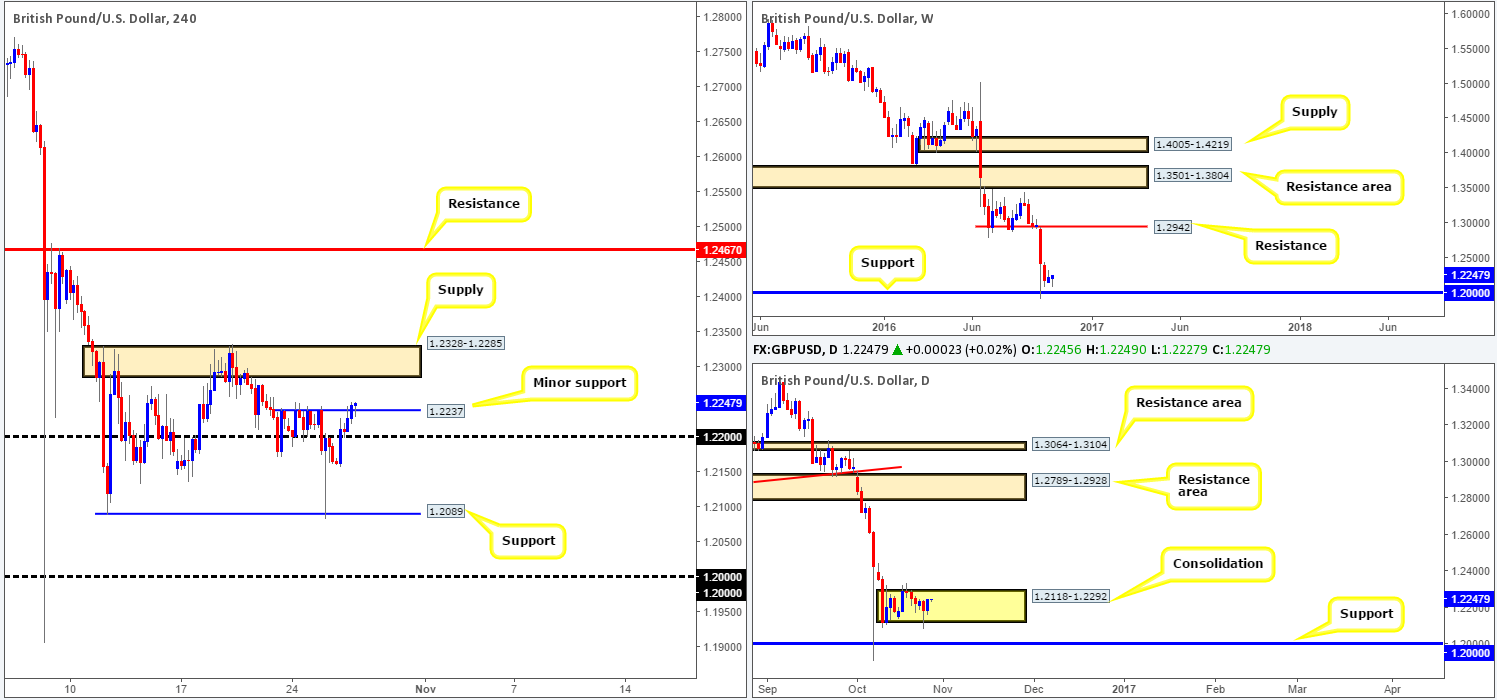
Cable pushed itself into positive territory yesterday on the back of broad US dollar weakness, consequently squeezing through offers at the 1.22 handle and the minor H4 resistance at 1.2237 (now acting support). This, as far as we can see, has likely opened up the path north to test H4 supply today at 1.2328-1.2285.
Over on the bigger picture, we can see that the daily candles are beginning to chisel out a consolidation just ahead of the 1.20 support at 1.2118-1.2292. On that note, let’s keep in mind that 1.20 also denotes the top edge of a major monthly demand, which can be seen here: http://fxtop.com/en/historical-exchange-rates-graph-zoom.php?C1=GBP&C2=USD&A=1&DD1=07&MM1=10&YYYY1=1960&DD2=14&MM2=10&YYYY2=2016&LARGE=1&LANG=en&VAR=0&MM1M=0&MM3M=0&MM1Y=0
Our suggestions: While a continuation move north from the minor H4 support at 1.2237 is logical, there’s not much room for us traders to play with seeing as there’s little more than 50 pips of space seen up to the aforementioned H4 supply. With that being the case, unless we see a push beyond the above noted H4 supply, which would likely clear the path north to H4 resistance at 1.2467, we feel becoming buyers in this market is challenging.
Data points to have noted today are as follows: UK prelim GDP report at 8.30am, US Durable goods at 12.30pm, along with the US weekly jobless claims print also released at 12.30pm GMT.
Levels to watch/live orders:
- Buys: To buy this pair, we recommend waiting for the H4 supply at 1.2328-1.2285 to be consumed as this will potentially open up the doors for price to challenge H4 resistance at 1.2467.
- Sells: Flat (Stop loss: N/A).
AUD/USD:
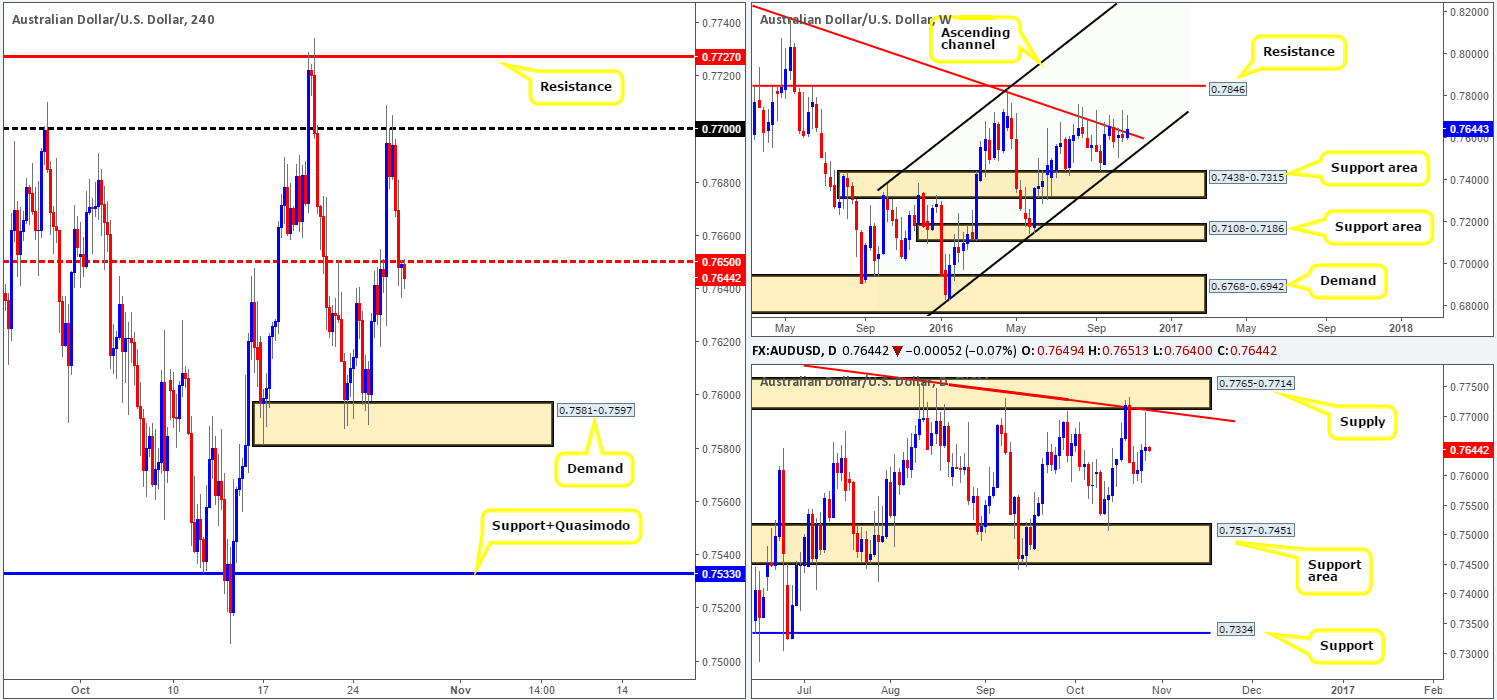
The aftermath of yesterday’s optimistic Australian inflation print, as you can see, sent the Aussie dollar screaming higher. The rally, however, was a relatively short-lived one, since the H4 candles peaked around the 0.77 handle and sold off going into the London segment.
As we write, we can see H4 action retesting the underside of a H4 mid-way resistance 0.7650. This begs the question: is this a stable enough level to sell from today? In short, we believe it could be. Not only did yesterday’s advance force price to come within touching distance of a daily trendline resistance extended from the high 0.7835, we also have to consider that weekly price may also look to close the week back below the current weekly trendline resistance drawn from the high 0.8295. On top of this, we see very little active H4 demand below 0.7650 until price reaches the 0.7581-0.7597 neighborhood.
Our suggestions: Put simply, watch for a reasonably sized H4 bearish close to take shape from 0.7650 today. In the event that this comes to realization, we’ll look to short, targeting the above said H4 demand, followed by the H4 combined support/Quasimodo at 0.7533 (sits directly above a daily support area at 0.7517-0.7451: the next downside target on that timeframe).
As far as economic data goes, traders will likely focus on the US Durable goods reading at 12.30pm, along with the US weekly jobless claims print also released at 12.30pm GMT.
Levels to watch/live orders:
- Buys: Flat (Stop loss: N/A).
- Sells: 0.7650 region ([H4 bearish close required] Stop loss: ideally beyond the trigger candle).
USD/JPY:
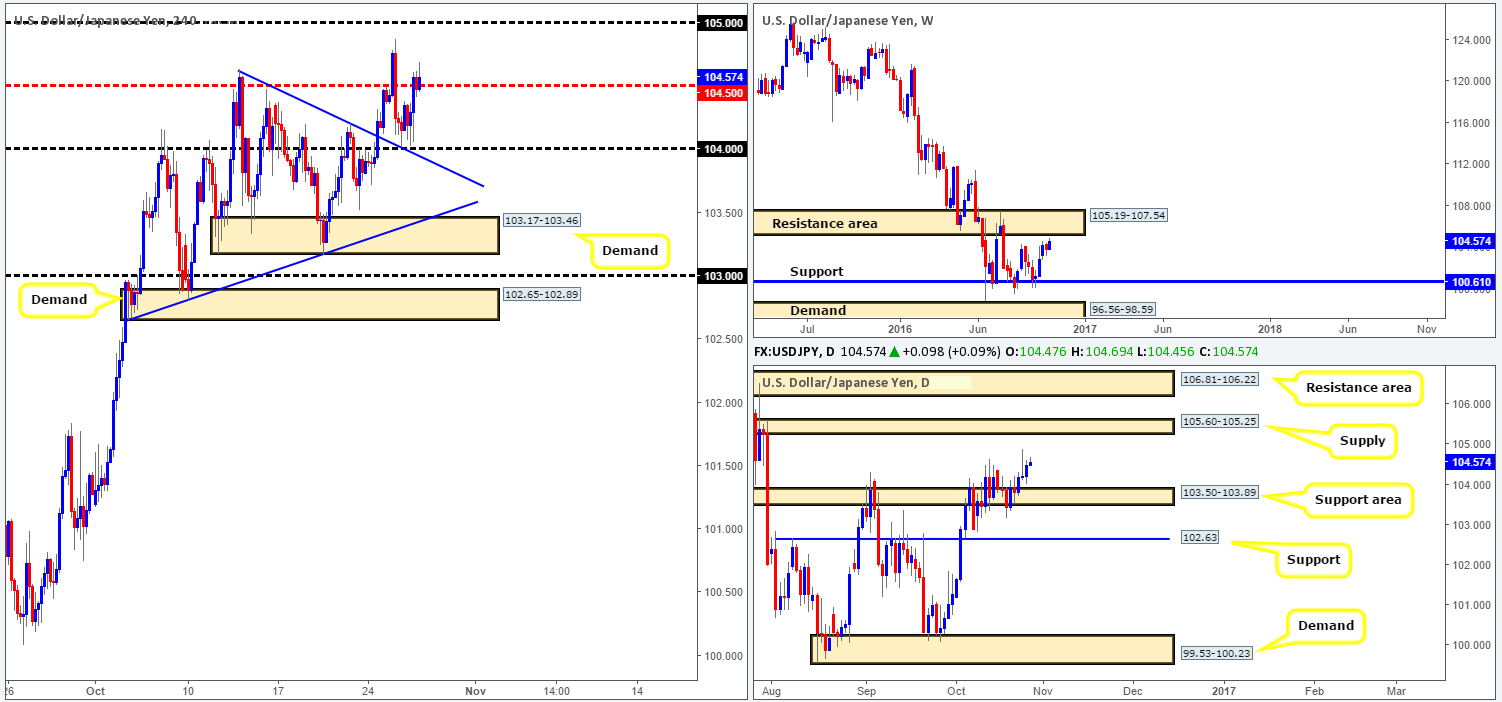
Based on recent H4 price action, the pair managed to catch a bid from the 104 boundary, which, as you can see, converges beautifully with a H4 trendline support taken from the high 104.63. From thereon, the unit rallied higher, consequently closing above the H4 mid-way resistance level 104.50 by the day’s end.
Ultimately, what we’re looking for from here is a continuation move north today up to the 105 neighborhood. Between here and 105.25 is, what we believe to be, a noteworthy sell zone. The reason for why is as follows:
- 1.05 is a psychological level watched by the majority of the market.
- 105.19 represents the underside of a weekly resistance area.
- 105.25 signifies the underside of a daily supply zone.
Our suggestions: Watch for a reasonably sized H4 bearish candle to form from the 105.25/1.05 region. Should this come into view, a short from here, targeting 104.50 is, in our opinion, a valid call. However, at 12.30pm GMT we have the US Durable goods data being released at 12.30pm, along with the US weekly jobless claims print also at 12.30pm GMT, so do remain vigilant during this time.
Levels to watch/live orders:
- Buys: Flat (Stop loss: N/A).
- Sells: 105.25/1.05 ([H4 bearish close required] Stop loss: ideally beyond the trigger candle).
USD/CAD:
For those who have been following our reports on the USD/CAD over the past week, you will recall that our team is presently short this market from 1.3315, with a stop set above the daily supply (1.3405-1.3259) at 1.3407. Although we have been in drawdown for quite some time now, there is still a chance that the candles could reverse track and trade lower.
Let’s remind ourselves of why we took this trade, and then you may understand our rationale behind holding on to this losing position. The reasoning largely comes from the higher-timeframe structures. Weekly price recently locked horns with a resistance level coming in at 1.3381, as well as daily price seen trading deep within a supply zone at 1.3405-1.3259. Furthermore, there’s a strong-looking daily convergence point seen within this supply made up of: a 38.2% Fib resistance level at 1.3315 (green line), the weekly resistance level at 1.3381, a channel resistance taken from the high 1.3241 and an AB=CD completion point around the 1.3376ish range. In addition to this, the oil market is currently testing a H4 support barrier at 48.97, which could suggest the USD/CAD may weaken.
Our suggestions: Despite our desk already being short, we would not advise selling right now. Instead, let the sellers prove their intention beforehand. Wait for a decisive close below the 1.33 handle. This would likely do two things. Firstly, confirm downside to the 1.32 handle, and secondly confirm bearish strength from the higher-timeframe structures mentioned above. To sell beyond 1.33, nevertheless, we recommend waiting for a retest to the underside of this number, followed by a reasonably sized H4 bearish candle.
Calendar events to keep an eye on today are the US Durable goods reading at 12.30pm, along with the US weekly jobless claims print also released at 12.30pm GMT.
Levels to watch/live orders:
- Buys: Flat (Stop loss: N/A).
- Sells: 1.3315 ([live] Stop loss: 1.3407). Watch for a close below the 1.33 handle and then look to trade any retest seen thereafter (H4 bearish close required).
USD/CHF:
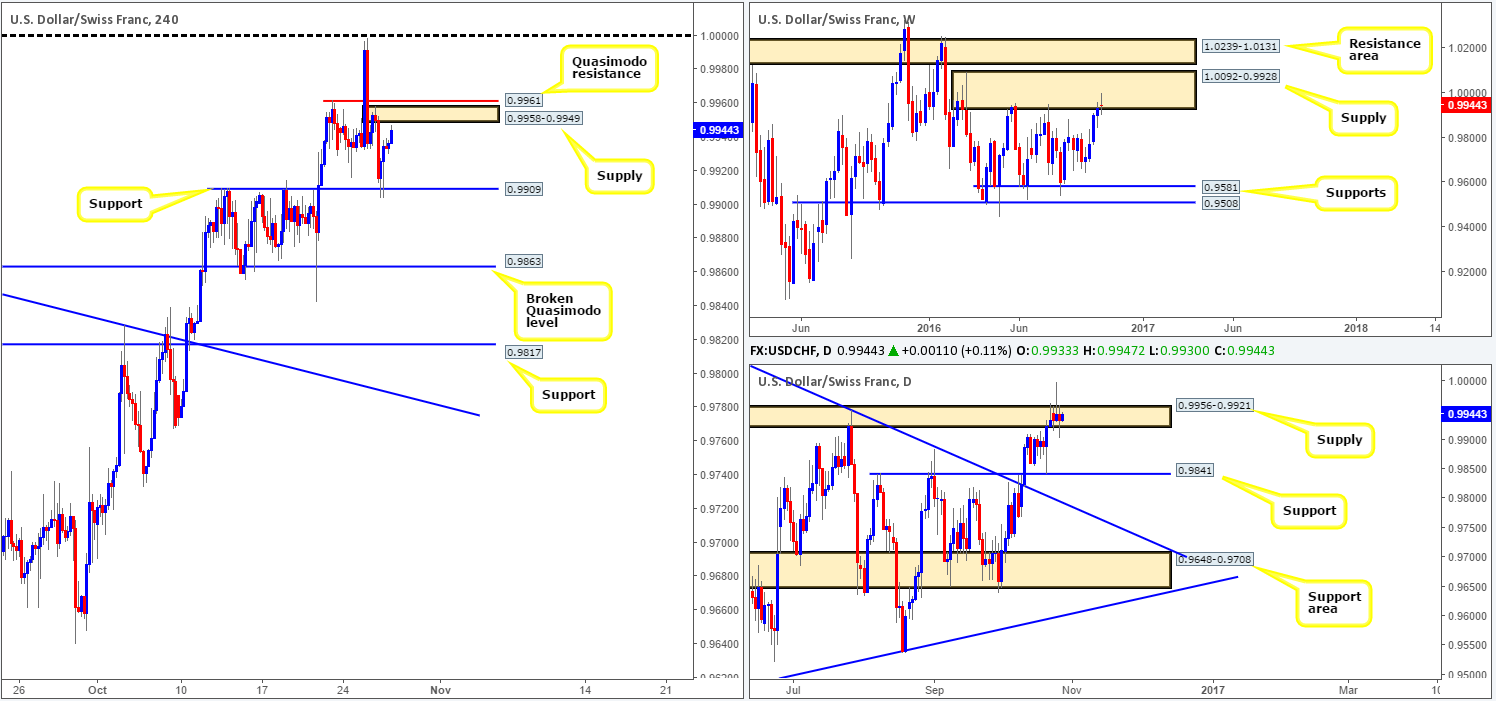
Despite the pair currently trading from within a weekly supply area at 1.0092-0.9928, and also loitering within a daily supply zone at 0.9956-0.9921, H4 support drawn from 0.9909 managed to hold ground yesterday. In light of this, we fail to see price breaking beyond the H4 supply seen at 0.9958-0.9949 (bolstered by a H4 Quasimodo resistance penciled in at 0.9961) today.
To become sellers in this market, however, a pivotal close beyond the 0.9909 level would need to be seen. This would likely free the runway south down to 0.9863: a H4 broken Quasimodo line – located just above a daily support at 0.9841 that is considered to be the next downside target on the daily timeframe.
Our suggestions: Following a close below 0.9909, our desk would look to short on a retest to the underside of this number (H4 bearish close required).
With little data being seen on the docket for the Swiss Franc today, investors will likely focus their attention to the US Durable goods reading at 12.30pm, along with the US weekly jobless claims print also released at 12.30pm GMT.
Levels to watch/live orders:
- Buys: Flat (Stop loss: N/A).
- Sells: Watch for a close below the H4 support at 0.9909 and then look to trade any retest seen thereafter (H4 bearish close required).
DOW 30:
(Given the little change in structure much of the following analysis remains the same as Wednesday’s report)
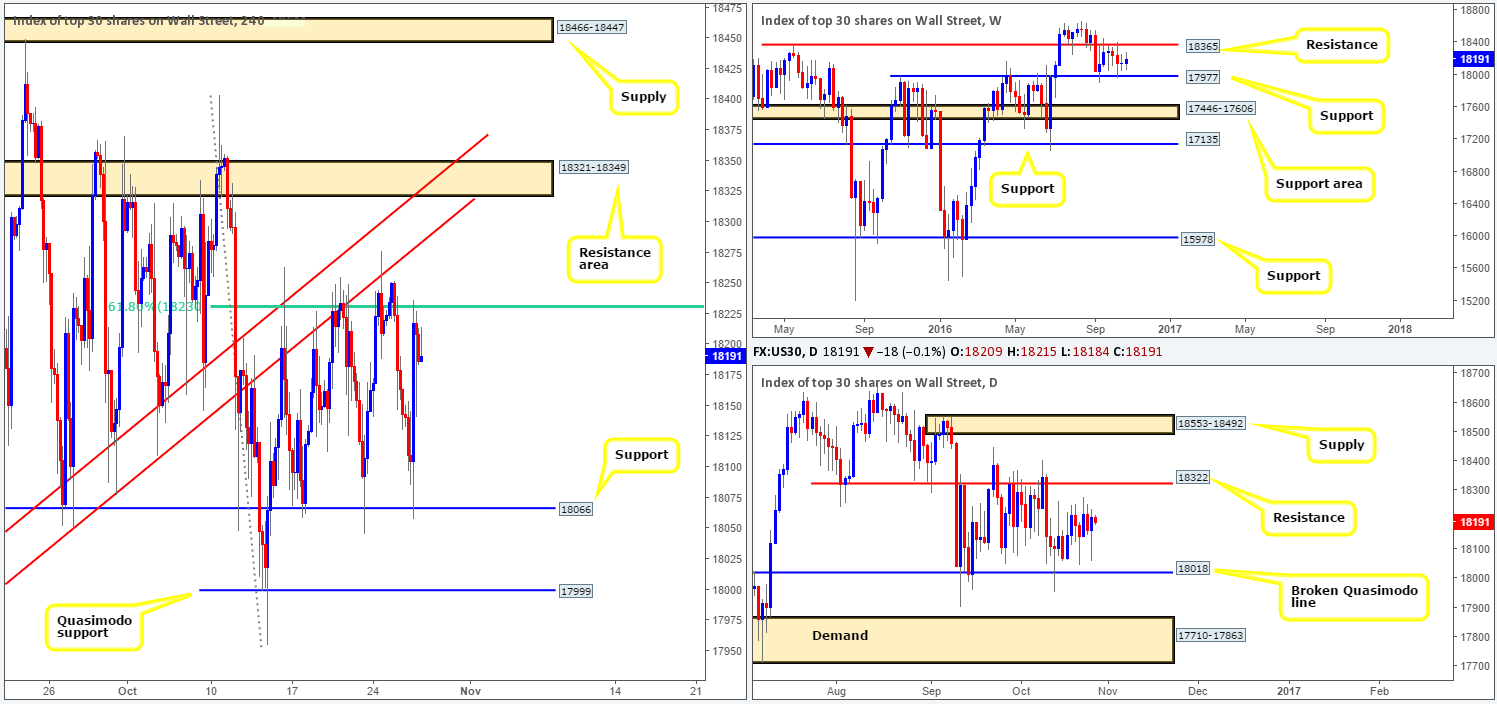
And so the range continues! Equities remain locked between a H4 61.8% Fib resistance level at 18230 (bolstered by a trendline resistance chalked up from the low 17959) and a H4 support registered at 18066. This has been in place since mid-October, and both range edges have proven their valor during this time.
Of course, given how well respected the range limits have been over the past couple of weeks, traders may want to consider trading within this box. However, for us personally, as we have mentioned multiple times in previous reports, we are not interested in trading here. Instead, the only areas we have interest in at the moment is the H4 Quasimodo support at 17999 and the H4 resistance area at 18321-18349. The Quasimodo is attractive because it fuses with nearby weekly support at 17977 and also the daily broken Quasimodo line at 18018.The resistance zone, nonetheless, is equally attractive since it houses the daily resistance level at 18322 and is located just below weekly resistance at 18365.
However, to avoid being stopped out by one of those dreaded whipsaws; we’d recommend waiting for a H4 close prior to risking capital at these areas.
Levels to watch/live orders:
- Buys: 17999 ([H4 bullish close required] Stop loss: ideally beyond the trigger candle).
- Sells: 18321-18349 ([H4 bearish close required] Stop loss: ideally beyond the trigger candle).
GOLD:
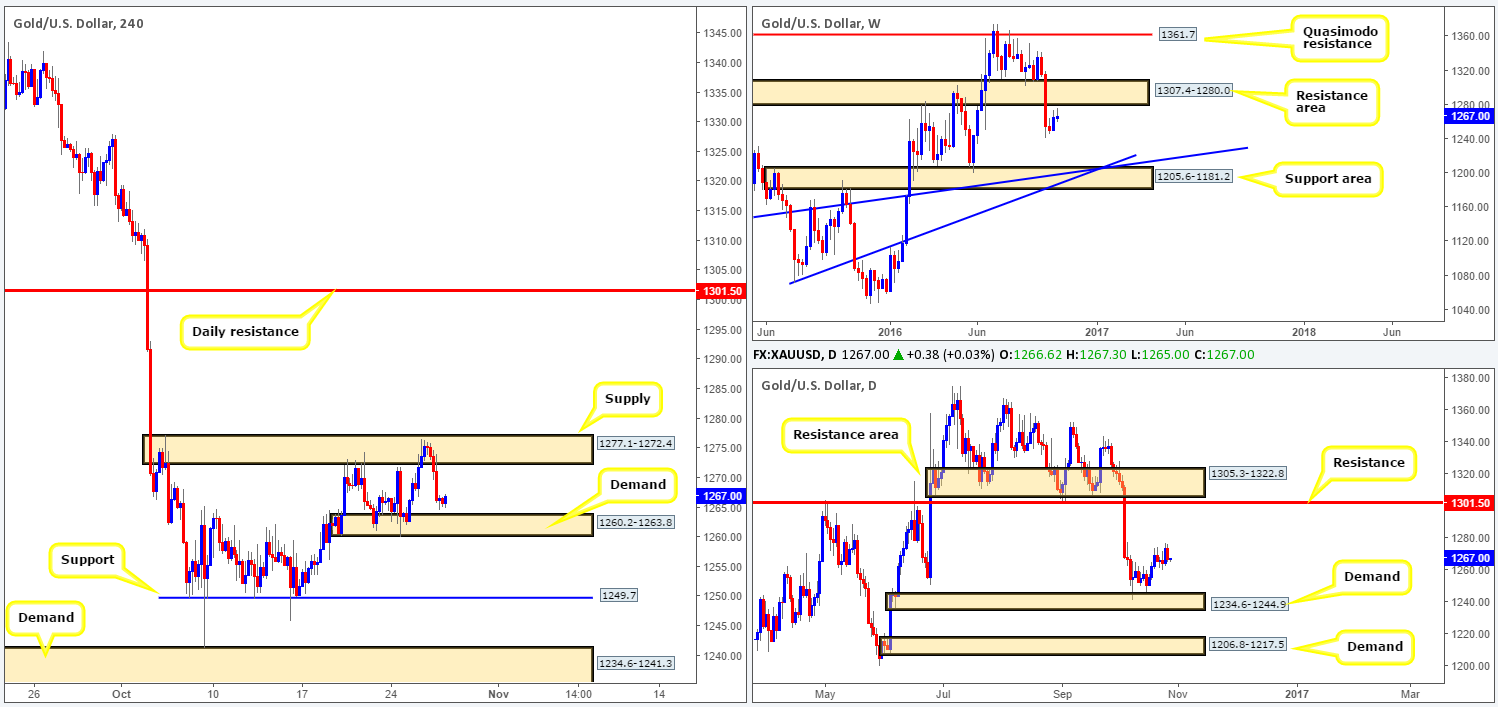
H4 supply at 1277.1-1272.4, once again, managed to hold the yellow metal lower yesterday, consequently bringing bullion down to lows of 1264.5 on the day. Our desk now considers this timeframe to have entered into a phase of consolidation between the above noted H4 supply and a H4 demand base carved from 1260.2-1263.8. A violation of this H4 demand area would likely stimulate a decline back down to the 1249.7 region: a H4 support. Meanwhile, if the current H4 supply area is engulfed, daily resistance at 1301.5 is likely the next target on the hit list.
Turning our attention over to the higher timeframes, we can see that weekly action recently came close to testing the underside of a resistance area drawn from 1307.4-1280.0. Looking down to the daily chart, nevertheless, gold appears to be trading in no-man’s-land at the moment between the aforementioned daily resistance level and a daily demand zone coming in at 1234.6-1244.9.
Our suggestions: In spite of the recent selloff from the current H4 supply, our team is still interested in seeing a break above this barrier. The reason being, as we highlighted in yesterday’s report, is that beyond this barrier, the pathway north on the H4 is clear up to the aforementioned daily resistance. As such, should price retest this boundary as demand (after a close higher) followed by a reasonably sized H4 bull candle, one could look to go long from here targeting the daily level. However, do remain aware that by entering long from here, even with the confirmation of a H4 bull candle, you’re effectively buying directly into a weekly resistance area.
Should a close be seen below the current H4 demand on the other hand, we may, depending on if the H4 candles retest the underside of this area as supply, look to short from here (H4 bearish close required), given how close price recently came to testing the weekly resistance area mentioned above.
Levels to watch/live orders:
- Buys: Watch for a close above the H4 supply at 1277.1-1272.4 and then look to trade any retest seen thereafter (H4 bullish close required).
- Sells: Watch for a close below the H4 demand at 1260.2-1263.8 and then look to trade any retest seen thereafter (H4 bearish close required).
