EUR/USD:
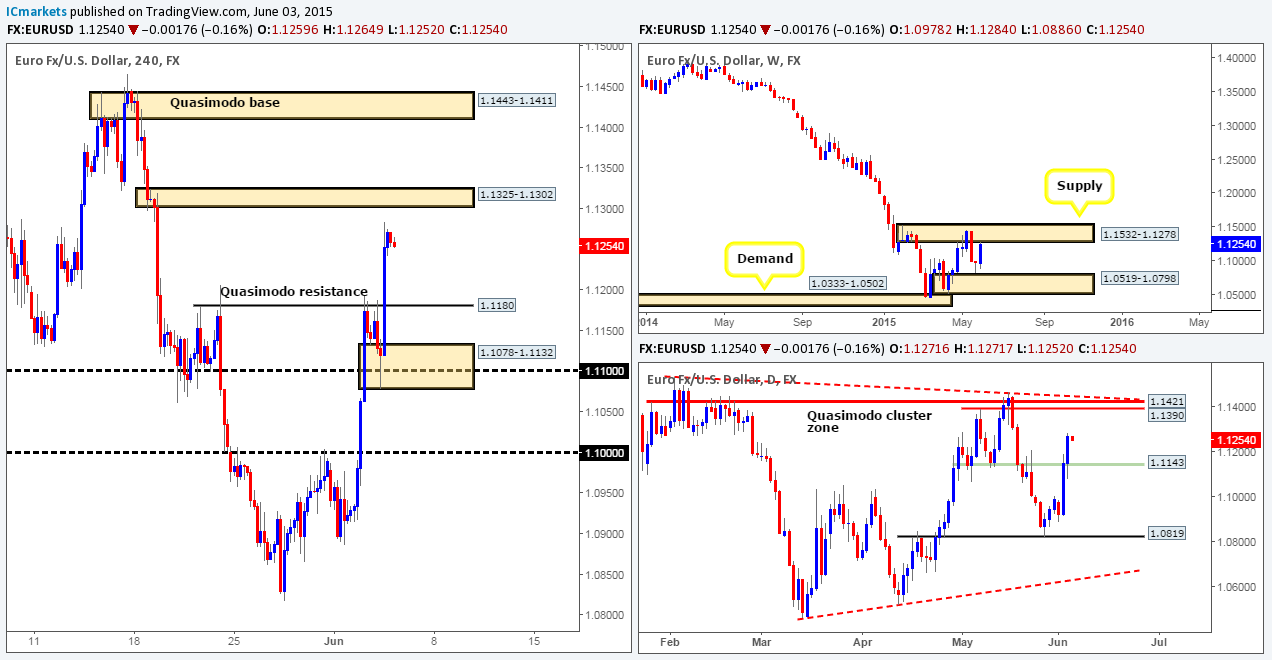
Weekly view – From a long-term standpoint, the downtrend on this pair is still very much intact. It’s only once or if we see a close above the weekly supply area at 1.1532-1.1278 will we be convinced the trend may be shifting direction.
Daily view: The daily timeframe shows that the Euro continued to march north during yesterday’s session, taking out the daily swap level 1.1143, and potentially clearing the path north for further upside towards a daily Quasimodo cluster zone coming in at 1.1390/1.1421 (located deep within the aforementioned weekly supply area), which, as you can also see converges beautifully with a daily trendline extended from the high 1.1532.
4hr view: Going into yesterday’s European/London session, we can see that the Euro sold off from the 4hr Quasimodo resistance level at 1.1180 down to the psychological barrier 1.1100. 1.1100, as you can see held firm, and allowed longs to push this market north consequently consuming the 4hr Quasimodo barrier.
From where we’re standing, we see little reason why price will not shake hands with the 4hr supply area seen at 1.1325-1.1302 sometime soon. However, before this happens, we have to be prepared for the possibility that a retracement may be seen down to the recently broken 4hr Quasimodo level, or even the 4hr demand area seen just below it at 1.1078-1.1132. Both of these areas are certainly on our watchlist for potential trades.
Regarding the 4hr supply area at 1.1325-1.1302, one could say this is a nice zone to short from seeing as it converges with the lower limit of the weekly supply area at 1.1532-1.1278. As such, once/if price enters the jaws of this 4hr zone, we’ll closely watch lower timeframe price action for any weakness to take advantage of. The reason we’re not simply placing a pending sell order here is due to the fact that price could ignore this 4hr area completely and head for the 4hr Quasimodo base at 1.1443-1.1411. This area, as you will be able to see by looking at the daily timeframe lines up nicely with the aforementioned daily Quasimodo cluster zone, and as per the daily timeframe, we can see there is ROOM FOR PRICE TO MOVE FURTHER north, hence the reason why we’re not placing a pending sell order around the 4hr supply area at 1.1325-1.1302.
Levels to watch/live orders:
- Buys: 1.1180 [Tentative – confirmation required] (Predicative stop-loss orders seen at: dependent on where one confirms this level) 1.1078-1.1132 [Tentative – confirmation required] (Predicative stop-loss orders seen at: 1.1071).
- Sells: 1.1325-1.1302 [Tentative – confirmation required] (Predicative stop-loss orders seen at: 1.1330).
GBP/USD:
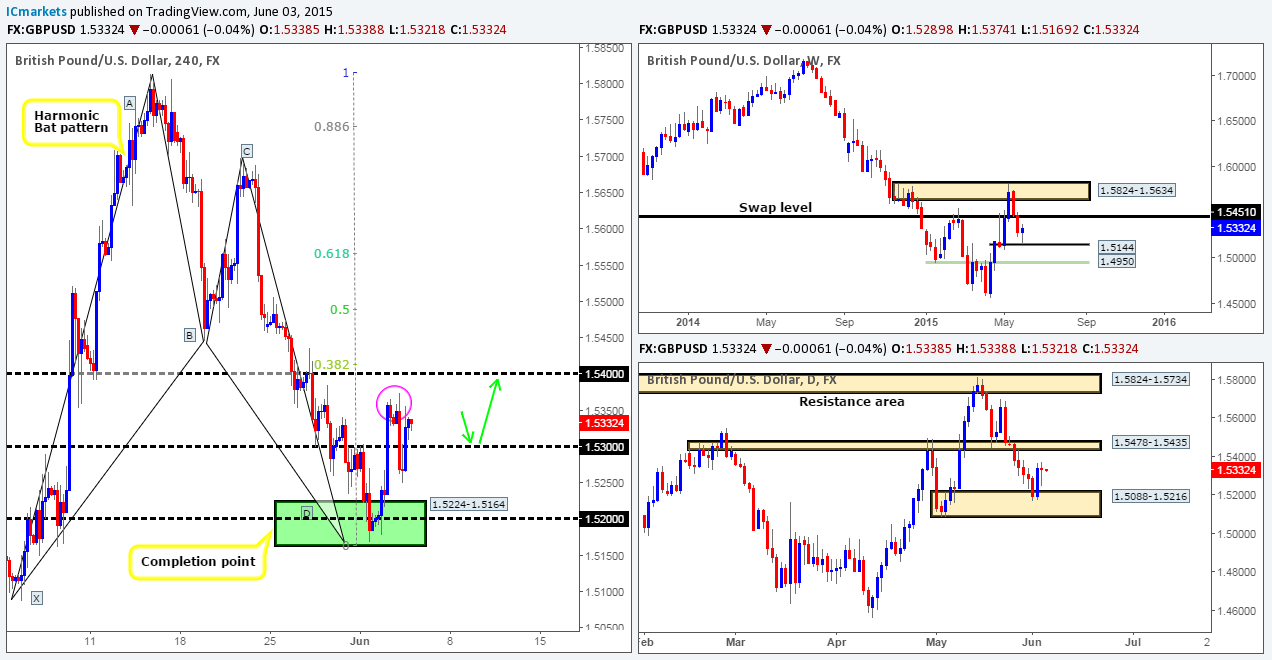
Weekly view – The weekly timeframe shows that active buying recently come into the market from just above a weekly swap level positioned at 1.5144.Assuming that the buyers can continue with this tempo, it’s possible we may see price challenge the weekly swap level 1.5451, or given enough time, the weekly supply area seen just above it at 1.5824-1.5634.
Daily view: Following the rebound seen from daily demand at 1.5088-1.5216, the volatility seen during yesterday’s session was quite healthy. However, as you can see, that made little difference as price ended the day closing only three pips below yesterday’s close. As this moment, we see no reason why price will not continue pressing forward today towards the daily swap area seen at 1.5478-1.5435.
4hr view: For those who read our previous report on the GBP, you may recall that we are currently long (1.5228) this pair from the top side of the 4hr Harmonic Bat completion area seen in green at 1.5224-1.5164 (located around the upper limits of the aforementioned daily demand area). We also mentioned that before price reaches 1.5400 – our first take-profit target, we should expect a retracement down to 1.5300. This did occur, albeit a little deeper than expected though.
Despite the recent moves on this pair, our outlook remains much the same as yesterdays. Once/if price hits 1.5400 (converges with 0.382 – A-D retracement), we’ll likely look to move our stop to breakeven and take some profit. Following this, our final take-profit target will likely be set around the 1.5550 mark – the 0.618 Fibonacci retracement level.
1.5300 is still a number we’re going to be keeping a close eye on today. The 4hr supply in the pink circled area at 1.5374-1.5332 has potentially been consumed now. That being the case, if 1.5300 is retested as support, and holds firm, we’ll then look to add to our current long position (as per the green arrows) providing there is supporting lower timeframe confirming price action.
Levels to watch/ live orders:
- Buys: 1.5228 [Live] (Predicative stop-loss orders seen at: 1.5140) 1.5300 [Tentative – confirmation required] (Predicative stop-loss orders seen at: dependent on where one confirms this level).
- Sells: Flat (Predicative stop-loss orders seen at: N/A).
AUD/USD:
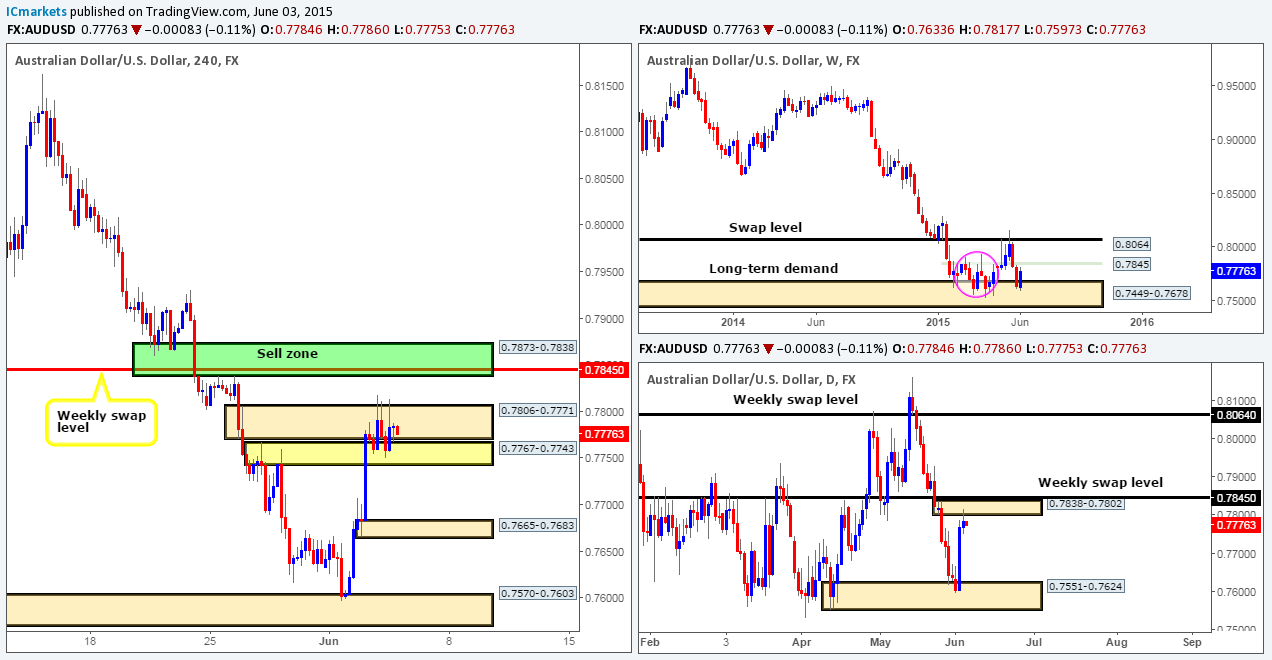
Weekly view – Long term, the trend on this pair is still southbound in our opinion, and will remain that way until we see a convincing push above 0.8064.
Current action on the other hand, shows that price is now trading from a long-term weekly demand area coming in at 0.7449-0.7678. Judging by the sloppy reaction seen (pink circle – 02/02/15-06/04/15) at this zone a few months earlier, however, things could potentially get messy here once again.
Daily view: The daily timeframe reveals that price has now connected with a small daily supply zone coming in at 0.7838-0.7802, and did show some rejection. Nonetheless, we may see a deeper push into this zone yet simply because price may want to tag in the weekly swap level sitting just above at 0.7845.
4hr view: In our previous report, we mentioned to be wary of the 4hr supply area at 0.7806-0.7771, as a fakeout above this zone into the lower limit of the daily supply area 0.7838-0.7802 was very possible. This, as you can see, did indeed happen. Following the fakeout, price fell and tested a small 4hr swap area painted in yellow at 0.7767-0.7743 which supported the market throughout yesterday’s sessions.
As long as the aforementioned 4hr swap area continues to support price going into today’s more liquid sessions, we may see the Aussie rally to shake hands with the weekly swap level at 0.7845. Should this take place today, we’ll look to try and short (with lower timeframe confirmation) this higher timeframe barrier around the green sell zone at 0.7873-0.7838.
Levels to watch/ live orders:
- Buys: Flat (Predicative stop-loss orders seen at: N/A).
- Sells: 0.7873-0.7838 region [Tentative – confirmation required] (Predicative stop-loss orders seen at: 0.7880).
USD/JPY:
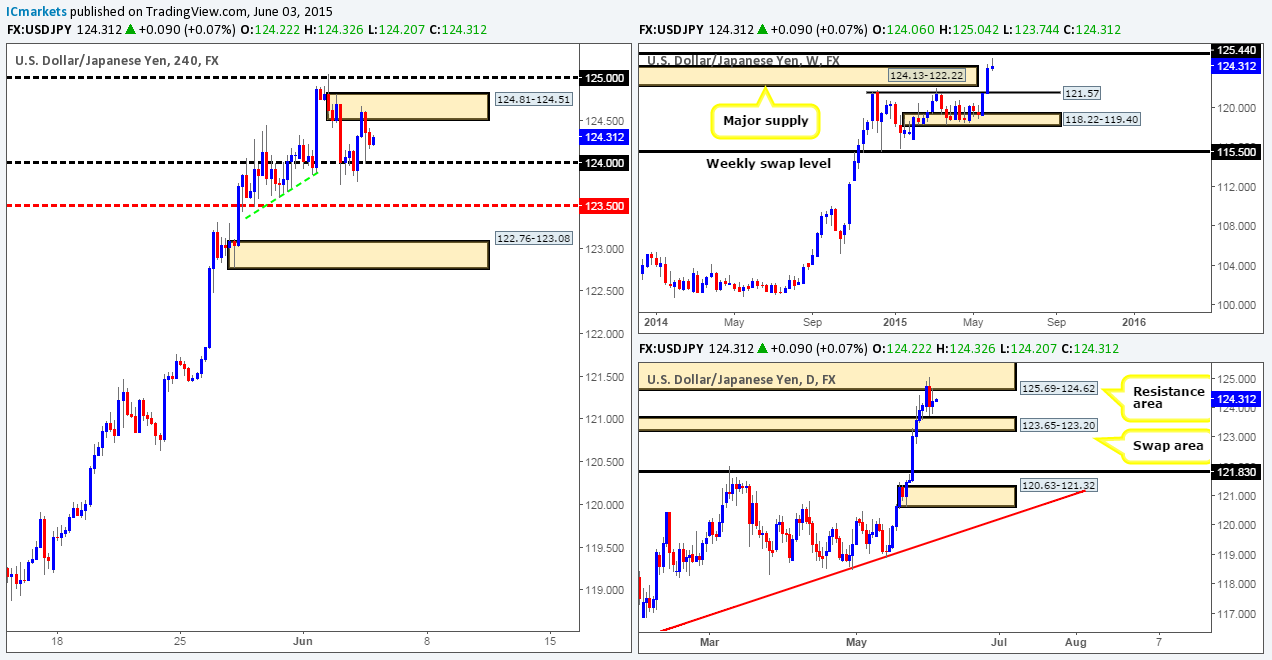
Weekly view – Essentially, the outlook on this pair remains positive. It is only once we see a close below the weekly swap level 115.50 will we be convinced the trend may be shifting.
Following the break above weekly supply at 124.13-122.22, active sellers appear to be entering the market forty pips from below a major weekly swap level coming in at 125.44. Should further selling be seen from here, we see very little supportive pressure coming into the market until 121.57 – a weekly swap level.
Daily view: The daily timeframe shows that price continues to trade in between a daily resistance area seen at 125.69-124.62 (surrounds the aforementioned weekly swap level) and a daily swap zone at 123.65-123.20.
4hr view: During yesterday’s sessions, in particular, the London session, price was heavily bought into from 124.00 – not really something we expected in all honesty. This buying saw this market hit a small 4hr supply area at 124.81-124.51, which as you can see, was respected going into the U.S session.
At the time of writing, there is very little opportunity to trade in our opinion, at least until the next decision is made between 124.00 and the 4hr supply area at 124.81-124.51. However, even once a decision is made, traders will need to be very careful in looking to trade as beyond these two zones, areas of support and resistance are sitting close by. Just below the 124.00 number, 1.2350 lurks just below. Conversely, just above the 4hr supply zone, sits 125.00.
Therefore, with everything taken into consideration, we have decided to remain flat on this pair until more conducive price action presents itself.
Levels to watch/ live orders:
- Buys: Flat (Predicative stop-loss orders seen at: N/A).
- Sells: Flat (Predicative stop-loss orders seen at: N/A).
USD/CAD:
Weekly view – Overall, the trend on this pair is still pointing north. A break below the weekly swap area 1.2034-1.1870 would be required to invalidate this bias. Current action, however, shows that the buyers and sellers are battling for position around a weekly swap (resistance) level coming in at 1.2439.
Daily view: From this angle, we can see that price is now trading relatively deep within a weak-looking daily swap (demand) area seen at 1.2464-1.2384.
4hr view: London’s open saw this pair take off north from 1.2400 and attack 1.2500, which, as you can see, was respected as resistance going into the U.S session, consequently pushing price down towards the mid-level number 1.2450.
Trading either long or short today from this mid-level number is risky in our opinion given the location of price on the higher timeframe picture (see above in bold). In addition to this, one would need to enter at this number with a relatively tight stop of around 15-20 pips in order to achieve a favorable risk/reward ratio (if targeting 1.2400 for shorts and 1.2500 for longs), which as you can probably imagine is not always possible. Taking all of the above into consideration, we’ve decided to remain flat on this pair for the time being.
Levels to watch/ live orders:
- Buys: Flat (Predicative stop-loss orders seen at: N/A).
- Sells: Flat (Predicative stop-loss orders seen at: N/A).
USD/CHF:
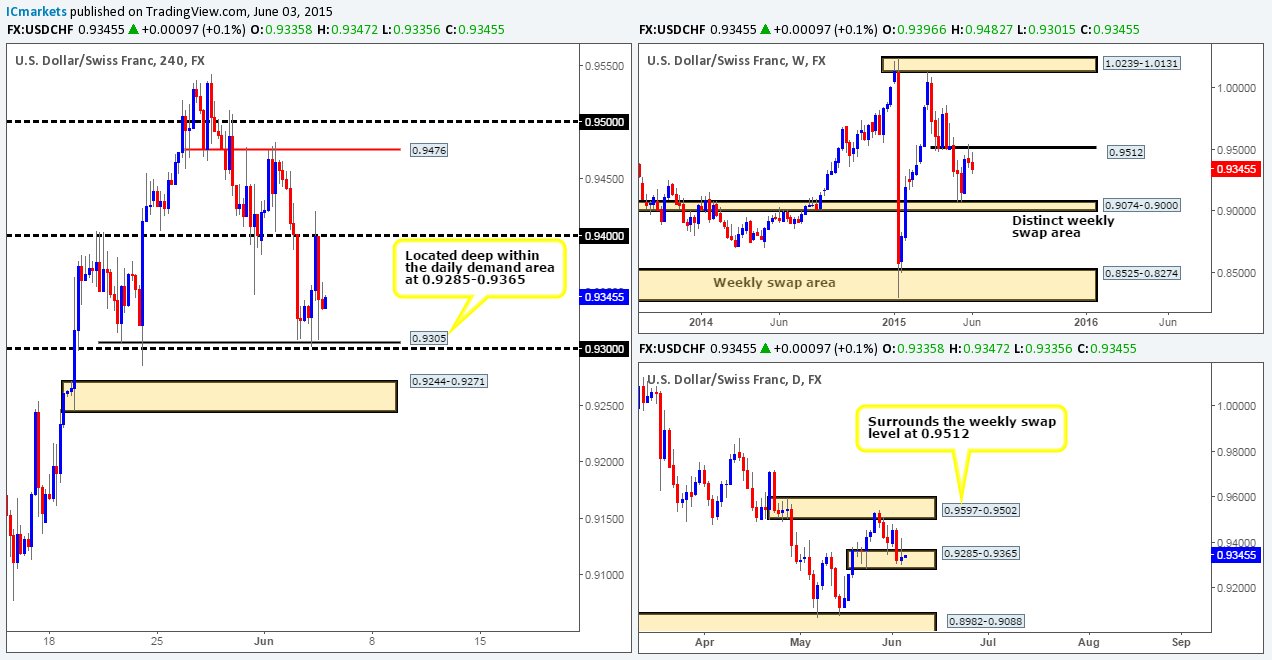
Weekly view – Following last week’s rebound from the weekly swap level 0.9512, follow-through selling is being seen. Provided that the sellers can maintain this position, it is possible we may see price attack the weekly swap area seen at 0.9074-0.9000 again.
Daily view: From this angle; we can still see price is trading within the daily demand area seen at 0.9285-0.9365. There is clearly buying interest within this zone as we saw during yesterday’s session when the buyers attempted to trade higher, but will this be enough to overcome the strong selling pressure clearly evident in this market at the moment? At the time of writing, it does not look hopeful!
4hr view: For those who read our last report, you may recall that we mentioned we’d only be interested in trading from the 4hr Quasimodo support/round number area at 0.9305/0.9300 if 0.9353 was taken out (see 30 minute timeframe). As you can see, this number was indeed consumed, but unfortunately did not give us a chance to enter long since price never retraced enough for us to get an entry before hitting our target – 0.9400.
Going forward, 0.9400 held well as we entered into the U.S session, consequently forcing price back down towards the 4hr Quasimodo area. Attempting to enter long from this base again, even with lower timeframe confirming price action is not really something our team is interested in taking part in, due to the fact that we’re seeing very little strength on the higher timeframe picture (see above) at the moment. Therefore, in the event that this level fails to hold today, we may see price head down towards the very fresh-looking 4hr demand area at 0.9244-0.9271 (located just below the aforementioned daily demand area). To safely enter long at this zone – even though we’re pretty confident a bounce will be seen from here, lower timeframe confirmation will need to be seen prior to risking capital. Should a lower timeframe entry be spotted here, the first trouble area to keep an eye on will likely be the round number/ 4hr Quasimodo area 0.9300/0.9305.
Levels to watch/ live orders:
- Buys: Flat (Predicative stop-loss orders seen at: N/A).
- Sells: Flat (Predicative stop-loss orders seen at: N/A).
US 30:
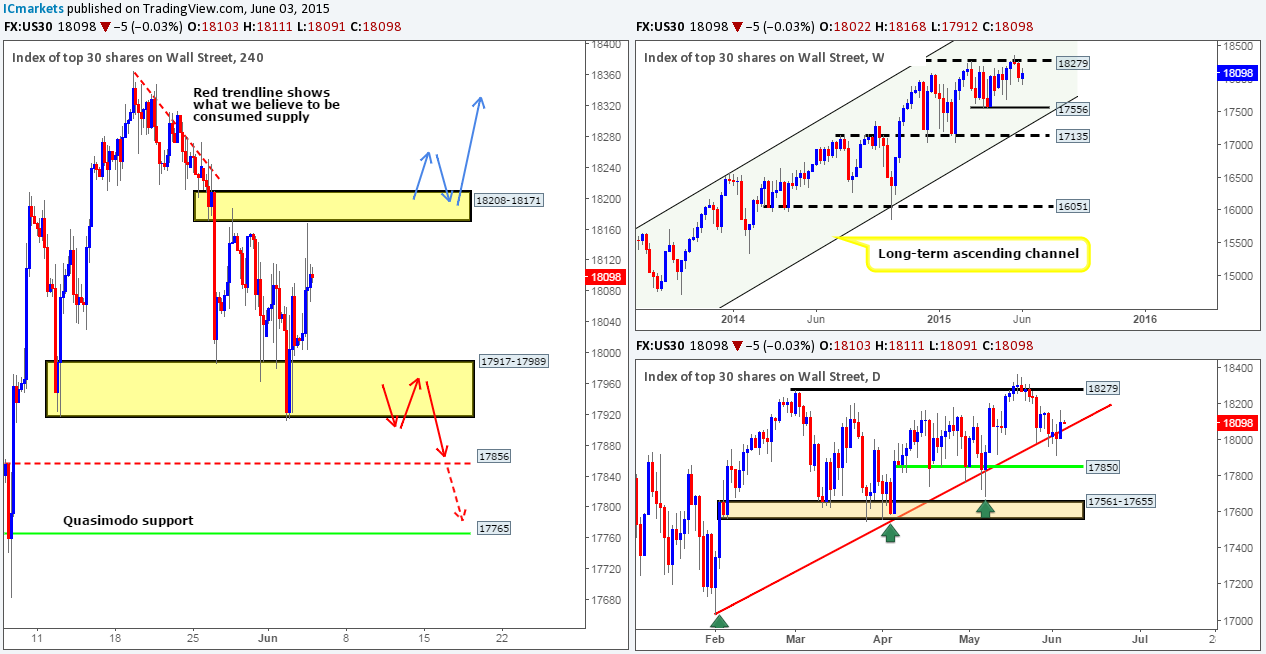
Weekly view – Overall, this index is still in a very strong uptrend. A push below the weekly support level 16051 would be required to invalidate this bias
The weekly timeframe shows that relatively strong resistance came into the market recently from the 18279 region. In the event that further selling is seen from here, we may see price challenge the weekly swing low 17556.
Daily view: Following Tuesday’s bearish close below the daily trendline level taken from the low 17033, the DOW rallied. Could this have just been a deep fakeout below the trendline? Let’s see what the 4hr timeframe has to say…
4hr view: Going into yesterday’s U.S session, we can see the buyers attacked the lower limit of a 4hr supply area at 18208-18171, but as you can see, there was clearly too much sell-side liquidity around this zone for the buyers to contend with.
As far as we can see, the DOW has now chiseled out a 4hr range between the aforementioned 4hr supply area and a 4hr demand zone coming in at 17917-17989. Due to this range being quite large in the overall scheme of things, trading at the extremes is certainly valid in our opinion (Buys – 17995 Sells – 18166). However, be mindful to the fact that consolidative areas such as this are prone to fakeouts, so waiting for lower timeframe confirmation at the range limits is highly recommended as this will allow you to avoid most fakeouts that take place.
On the flip side, should we see a push below the aforementioned 4hr demand area, it is likely the path south will be free down towards the 4hr swap level at 17856 (positioned a few points above the aforementioned daily support level), or given enough time, the 4hr Quasimodo support level at 17765 (see red arrows). Granted, there’s not a great risk/reward trade to be had here shorting the break, but if one were to find an entry on the retest of this area as supply with a tight enough stop, you could potentially manage a 2:0 trade down to 17856, obviously more if price continues on to 17765.
Conversely, a violation of the aforementioned 4hr supply zone could potentially suggest further upside towards at least 18340. The reason we believe price could stretch that far is simply because above this 4hr supply area we see nothing but consumed sellers. The wicks you see poking above the red trendline was likely the work of pro money spiking north to fill any unfilled sell orders to continue shorting this market, thus once/if price reaches this area, price should slice through this congested zone like a hot knife through butter. For us to consider a long position from this region, we would need to see a retest of this area as demand (see blue arrows) along with corresponding support from the lower timeframes.
Levels to watch/ live orders:
- Buys: 17917-17989 [Tentative – confirmation required] (Predicative stop-loss orders seen at: 17907).
- Sells: 18208-18171 [Tentative – confirmation required] (Predicative stop-loss orders seen at: 18215).
XAU/USD (Gold)
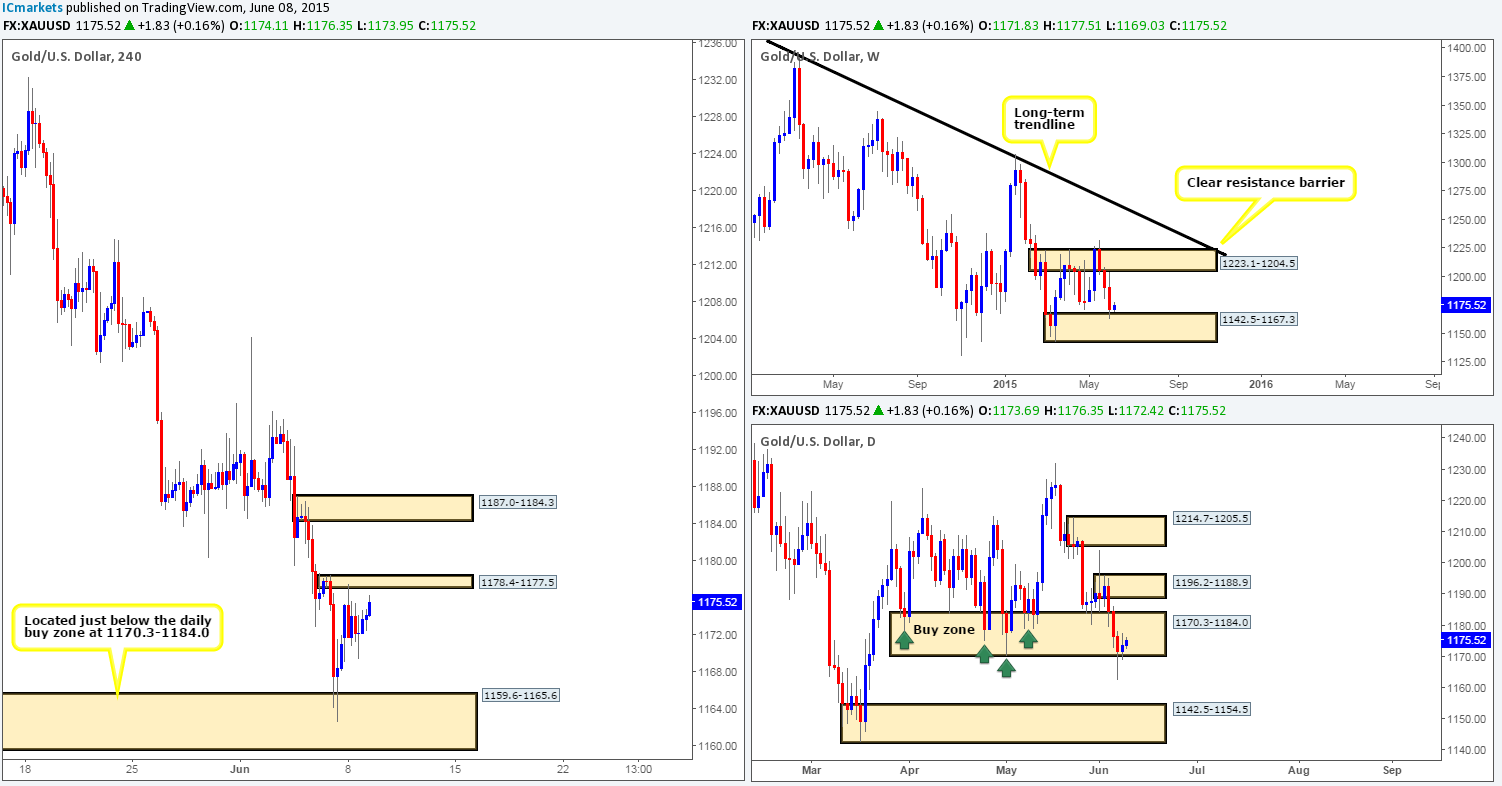
Weekly view – From a long-term perspective, the gold market is still trending south in our opinion. For this bias to be invalidated, a push above the weekly trendline extended from the high 1488.0 would need to be seen.
Recently, however, the buyers and sellers have been seen battling for position around the top of a small weekly demand area at 1170.3-1188.4. Assuming that this zone holds and a rally ensues, we could potentially witness price attack the aforementioned weekly trendline sometime in the next few weeks.
Daily view: The daily timeframe shows that price continues to tease the upper limits of a daily buy zone seen at 1170.3-1184.0 (located within the aforementioned weekly demand area). In addition to this, yesterday’s session saw the market print a fairly aggressive bear candle, wiping out any gains the market accumulated this week – not really something you want to see at a buy area really is it? It will be interesting to see what the 4hr timeframe has to offer…
4hr view: During yesterday’s sessions, in particular the European open, we saw the gold market plummet south from the 4hr swap area at 1191.1-1194.4. This selling continued into both the London and U.S sessions. It was only once price collided with the 4hr demand area at 1178.7-1184.6, did we see any sort of counter-attack.
It’s clear from this timeframe that this market has entered into a phase of consolidation between the two aforementioned 4hr zones. Due to this 4hr range being relatively tight, our team has decided to steer clear of trading within its boundaries. A break either side of this range, could however lead to some very nice trading opportunities. For example, in the case that the current 4hr swap area is engulfed, the river north should be somewhat ‘ripple free’ up to at least 1203.2/1205.8. However, for us to be given the ‘green light’ to enter long following a close higher, we’d need to see not only a strong retest of this swap area as demand, but also supporting lower timeframe strength. If, on the other hand, we see a push below the 4hr demand area, price will almost immediately attack a near-term 4hr Quasimodo support level at 1175.1, which is a level we have on our watchlist for potential buying opportunities in the future.
Levels to watch/ live orders:
- Buys: Flat (Predicative stop-loss orders seen at: N/A).
- Sells: Flat (Predicative stop-loss orders seen at: N/A).
