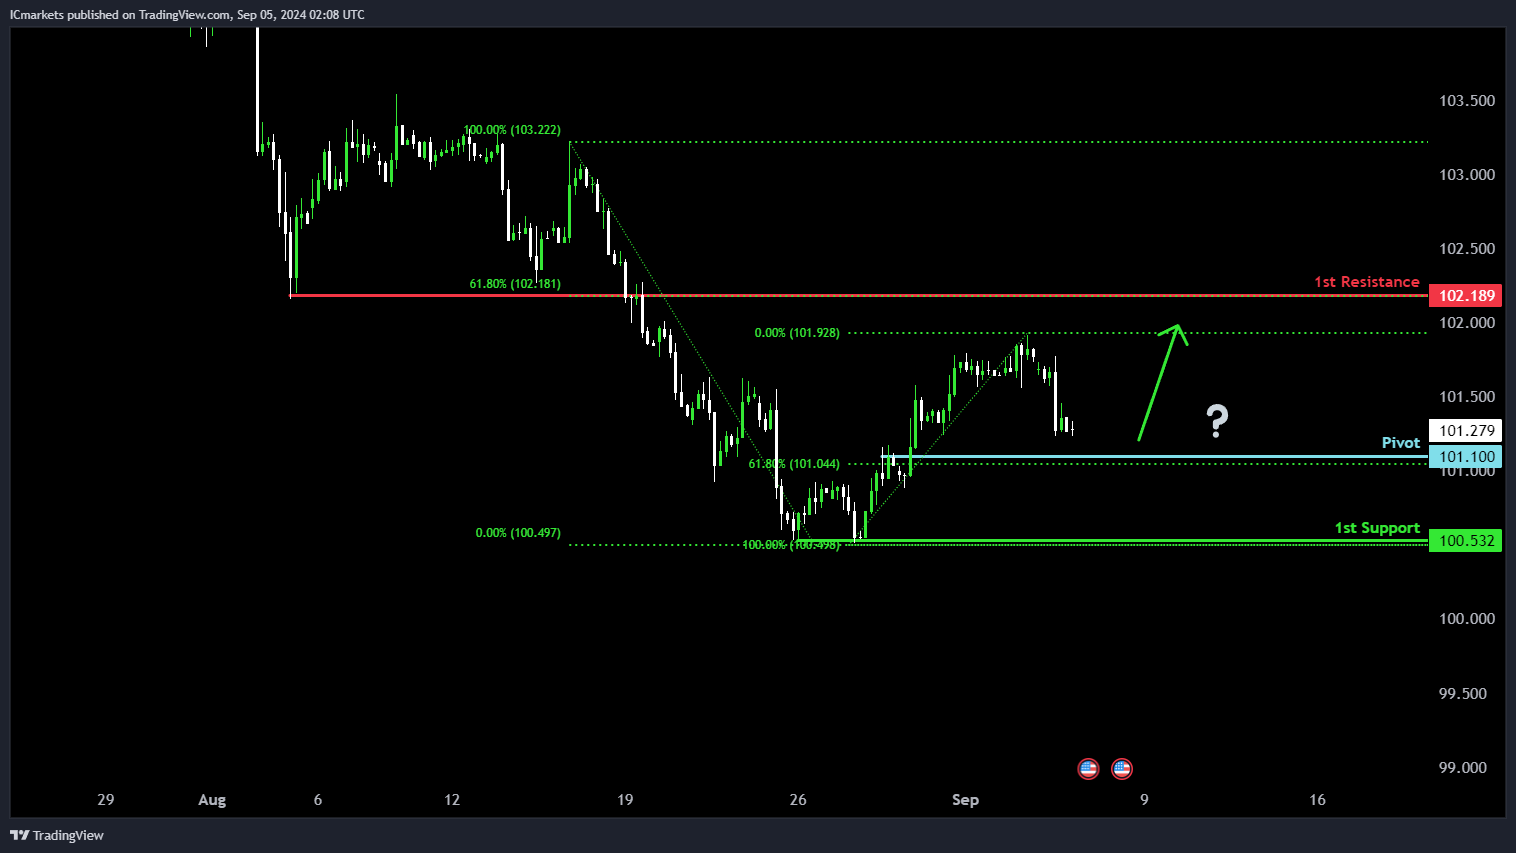
DXY (US Dollar Index):
Potential Direction: Bullish
Overall momentum of the chart: Bullish
Price could potentially make a bullish bounce off the pivot and head toward the 1st resistance.
Pivot: 101.10
Supporting reasons: Identified as a pullback support reinforced by the 61.80% Fibonacci Retracement, indicating a strong level where buyers may re-enter the market, pushing the price higher.
1st support: 100.53
Supporting reasons: Recognized as a multi-swing low support, suggesting this area has historically provided significant buying interest, stabilizing any potential downside moves.
1st resistance: 102.18
Supporting reasons: Marked as a pullback resistance level aligned with the 61.80% Fibonacci Retracement, highlighting an area where upward movement may face some resistance.
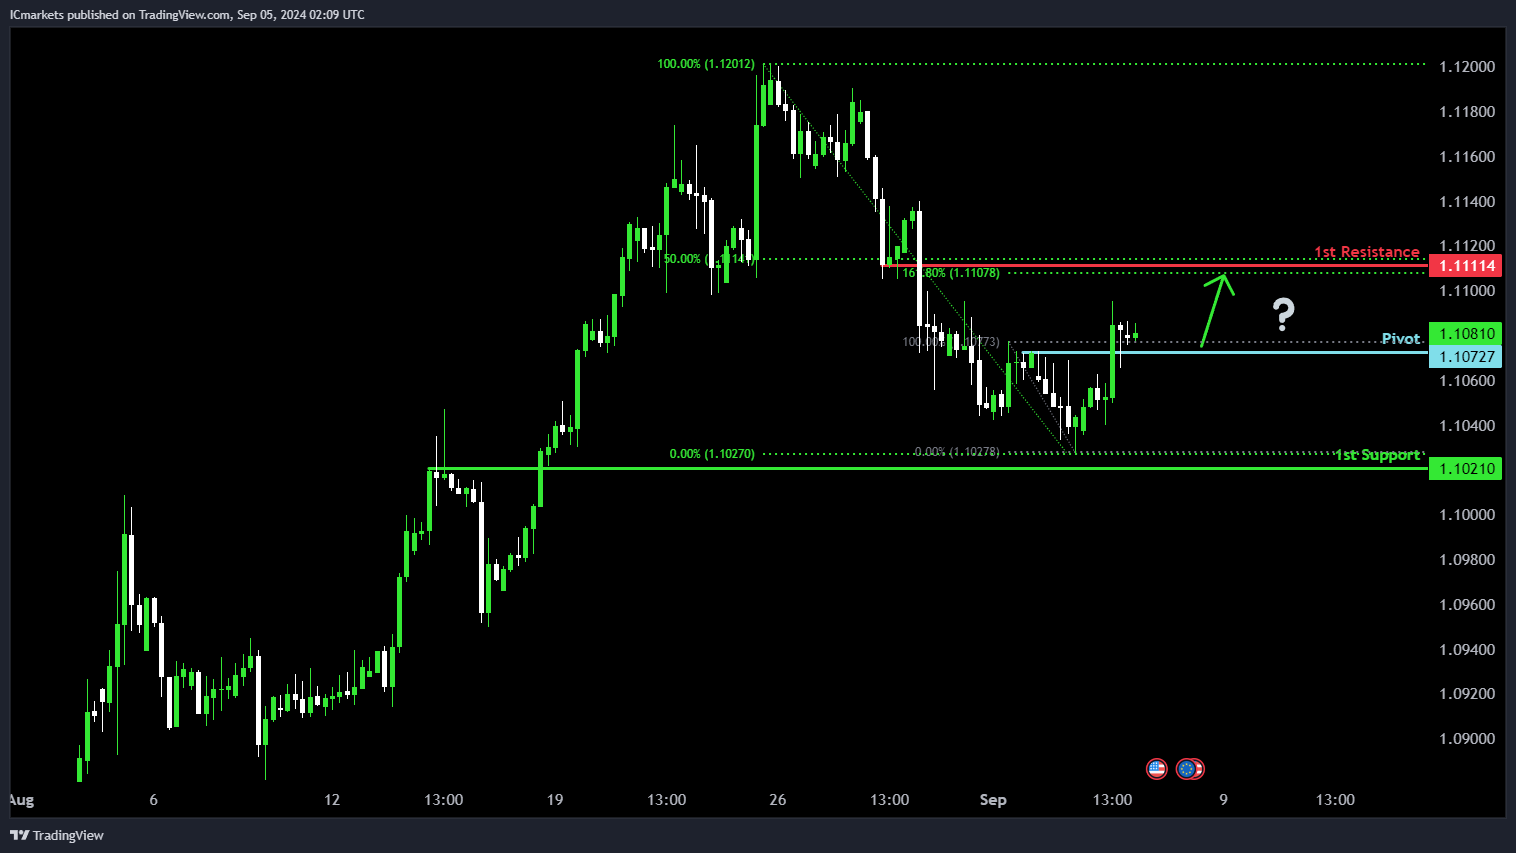
EUR/USD:
Potential Direction: Bullish
Overall momentum of the chart: Bearish
Price could potentially make a bullish bounce off the pivot and head toward the 1st resistance.
Pivot: 1.1072
Supporting reasons: Identified as an overlap support, indicating a level where previous market reversals have occurred, suggesting a possible upward move.
1st support: 1.1021
Supporting reasons: Recognized as a pullback support, where buyers have historically entered, stabilizing the price.
1st resistance: 1.1111
Supporting reasons: Marked as a pullback resistance, reinforced by the 50% Fibonacci Retracement and 161.80% Fibonacci Extension, signaling a confluence zone where upward momentum may face resistance.
EUR/JPY:
Potential Direction: Bearish
Overall momentum of the chart: Bearish
Price could potentially make a bearish reaction off the pivot and drop to the 1st support.
Pivot: 160.34
Supporting reasons: Identified as pullback resistance, reinforced by the 38.20% Fibonacci Retracement, indicating a potential level where selling pressure could re-enter.
1st support: 158.90
Supporting reasons: Recognized as an overlap support, suggesting a strong area where previous declines have found a floor.
1st resistance: 161.98
Supporting reasons: Marked as pullback resistance, supported by the 78.60% Fibonacci Retracement, where prior upward movements have been halted.

EUR/GBP:
Potential Direction: Bearish
Overall momentum of the chart: Bearish
Price could potentially make a bearish reaction off the pivot and drop to 1st support.
Pivot: 0.8453
Supporting reasons: Identified as pullback support, reinforced by the 23.60% Fibonacci Retracement, indicating a potential area where the price might stall before continuing downward.
1st support: 0.8384
Supporting reasons: Marked as swing low support, suggesting a significant area where previous declines have found a buying interest.
1st resistance: 0.8490
Supporting reasons: Recognized as pullback resistance, supported by the 38.20% Fibonacci Retracement, indicating a potential level where the price may face selling pressure if it retraces upward.

GBP/USD:
Potential Direction: Bearish
Overall momentum of the chart: Bearish
Price could potentially make a bearish reaction off the pivot and drop to the 1st support.
Pivot: 1.3181
Supporting reasons: Identified as an overlap resistance, reinforced by the 50% Fibonacci Retracement, indicating a level where selling pressure could emerge.
1st support: 1.3118
Supporting reasons: Recognized as pullback support, suggesting a significant area where buyers could provide support.
1st resistance: 1.3226
Supporting reasons: Identified as an overlap resistance, further strengthened by the 78.60% Fibonacci Retracement, where previous upward movements have faced resistance.

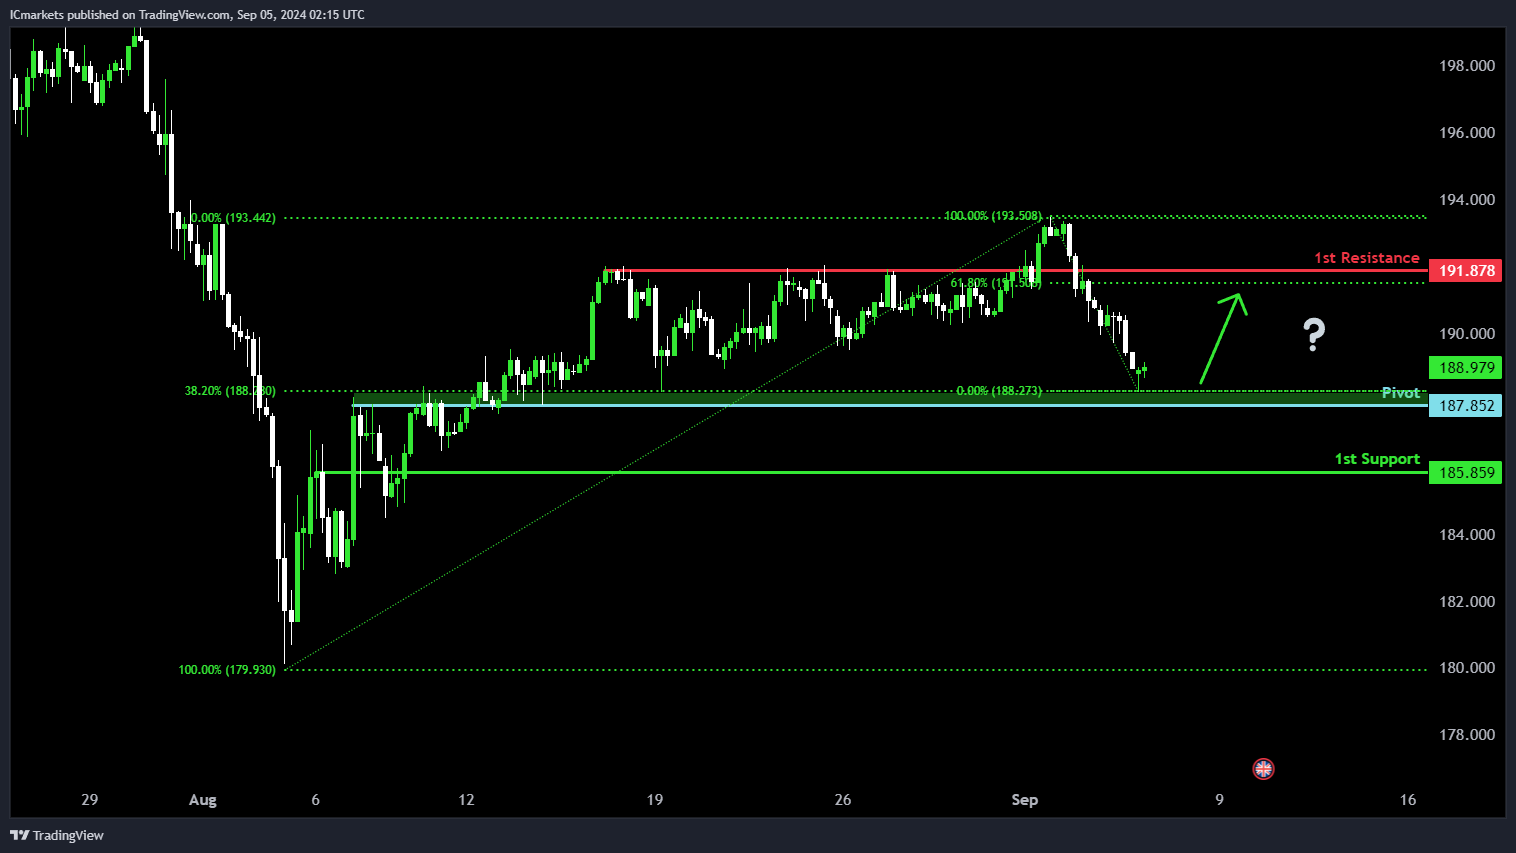
GBP/JPY:
Potential Direction: Bullish
Overall momentum of the chart: Bearish
Price could potentially make a bullish bounce off the pivot and head toward the 1st resistance.
Pivot: 187.85
Supporting reasons: Identified as an overlap support, reinforced by the 38.20% Fibonacci Retracement, indicating a key area where buying pressure may emerge.
1st support: 185.85
Supporting reasons: An overlap support level, suggesting a zone where previous declines have found support.
1st resistance: 191.87
Supporting reasons: Pullback resistance, bolstered by the 61.80% Fibonacci Retracement, indicating a potential area where price may face resistance.
USD/CHF:
Potential Direction: Bullish
Overall momentum of the chart: Bullish
Price could potentially make a bullish bounce off the pivot and head towards the 1st resistance.
Pivot: 0.8452
Supporting reasons: An overlap support reinforced by the 61.80% Fibonacci Retracement, indicating a strong area where buyers could re-enter the market.
1st support: 0.8403
Supporting reasons: Swing low support, marking a key level where the price has previously found buying interest.
1st resistance: 0.8562
Supporting reasons: Pullback resistance strengthened by the 50% Fibonacci Retracement, signaling a potential zone where price may face resistance.

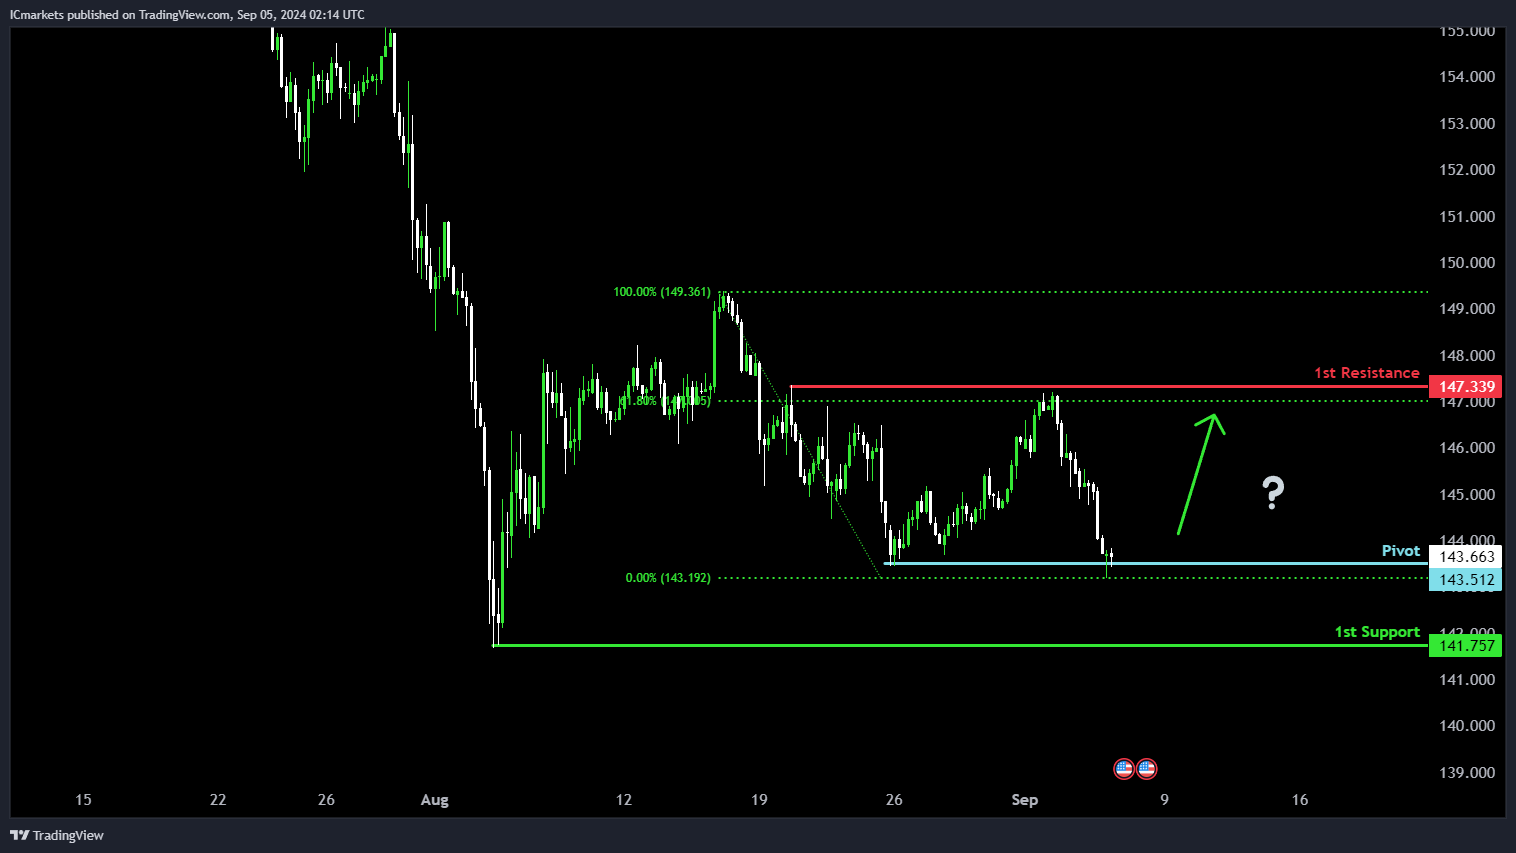
USD/JPY:
Potential Direction: Bullish
Overall momentum of the chart: Bullish
Price could potentially make a bullish bounce off the pivot and head towards the 1st resistance.
Pivot: 143.66
Supporting reasons: Multi-swing low support, indicating a level where previous declines have found buying interest.
1st support: 141.75
Supporting reasons: Swing low support, marking a significant area where the price has historically rebounded.
1st resistance: 147.33
Supporting reasons: Multi-swing high resistance, supported by the 61.80% Fibonacci Retracement, showing a potential area where price might face resistance.
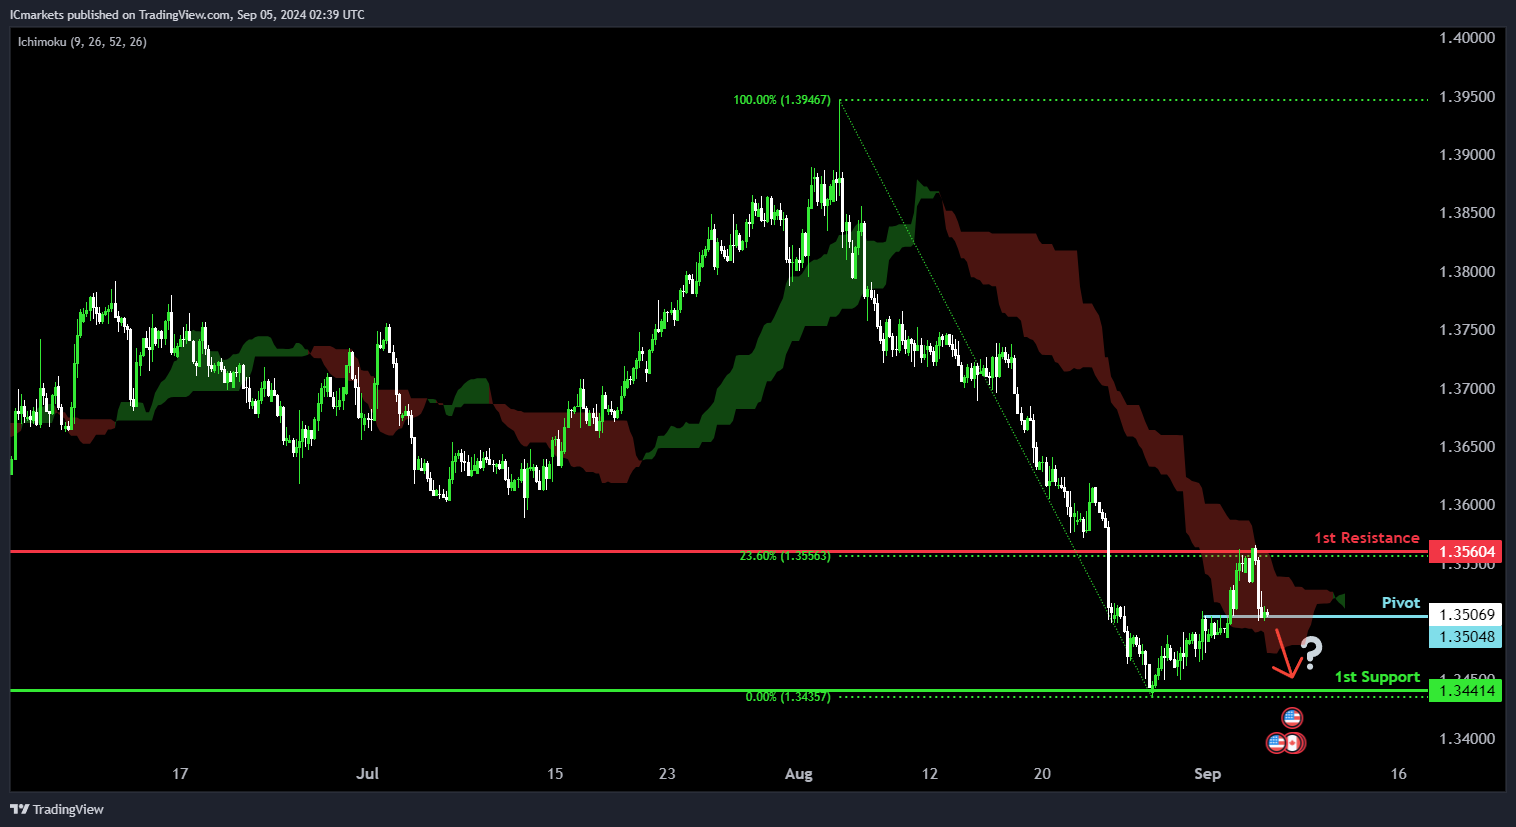
USD/CAD:
Potential Direction: Bearish
Overall momentum of the chart: Bearish
Price could make a bearish break below the pivot and potentially fall lower towards the 1st support.
Pivot: 1.3504
Supporting reasons: Identified as a potential breakout level where the strong bearish momentum could drive price lower.
1st support: 1.3441
Supporting reasons: Identified as a multi-swing-low support, indicating a potential area where price could find strong support.
1st resistance: 1.3560
Supporting reasons: Identified as an overlap resistance that aligns close to a 23.6% Fibonacci retracement, indicating a potential area that could halt any further upward movement.
AUD/USD:
Potential Direction: Bullish
Overall momentum of the chart: Neutral
Price has made bullish bounce around the pivot and could potentially rise towards the 1st resistance.
Pivot: 0.6699
Supporting reasons: Identified as a swing-low support, indicating a significant area where buying interests could pick up to stage a rebound.
1st support: 0.6642
Supporting reasons: Identified as an overlap support that aligns with a 38.2% Fibonacci retracement, suggesting a potential area where price could find support.
1st resistance: 0.6754
Supporting reasons: Identified as an overlap resistance that aligns with a 50% Fibonacci retracement, indicating a significant area that could halt further upward movement.

NZD/USD
Potential Direction: Bullish
Overall momentum of the chart: Neutral
Price has made a bullish bounce close to the pivot and could potentially rise towards the 1st resistance.
Pivot: 0.6163
Supporting reasons: Identified as an overlap support, indicating a significant area where buying interests could pick up to stage a rebound.
1st support: 0.6124
Supporting reasons: Identified as an overlap support that aligns with a 38.2% Fibonacci retracement, suggesting a potential area where price could find support.
1st resistance: 0.6252
Supporting reasons: Identified as an overlap resistance that aligns with a 61.8% Fibonacci retracement, indicating a significant area that could halt further upward movement.

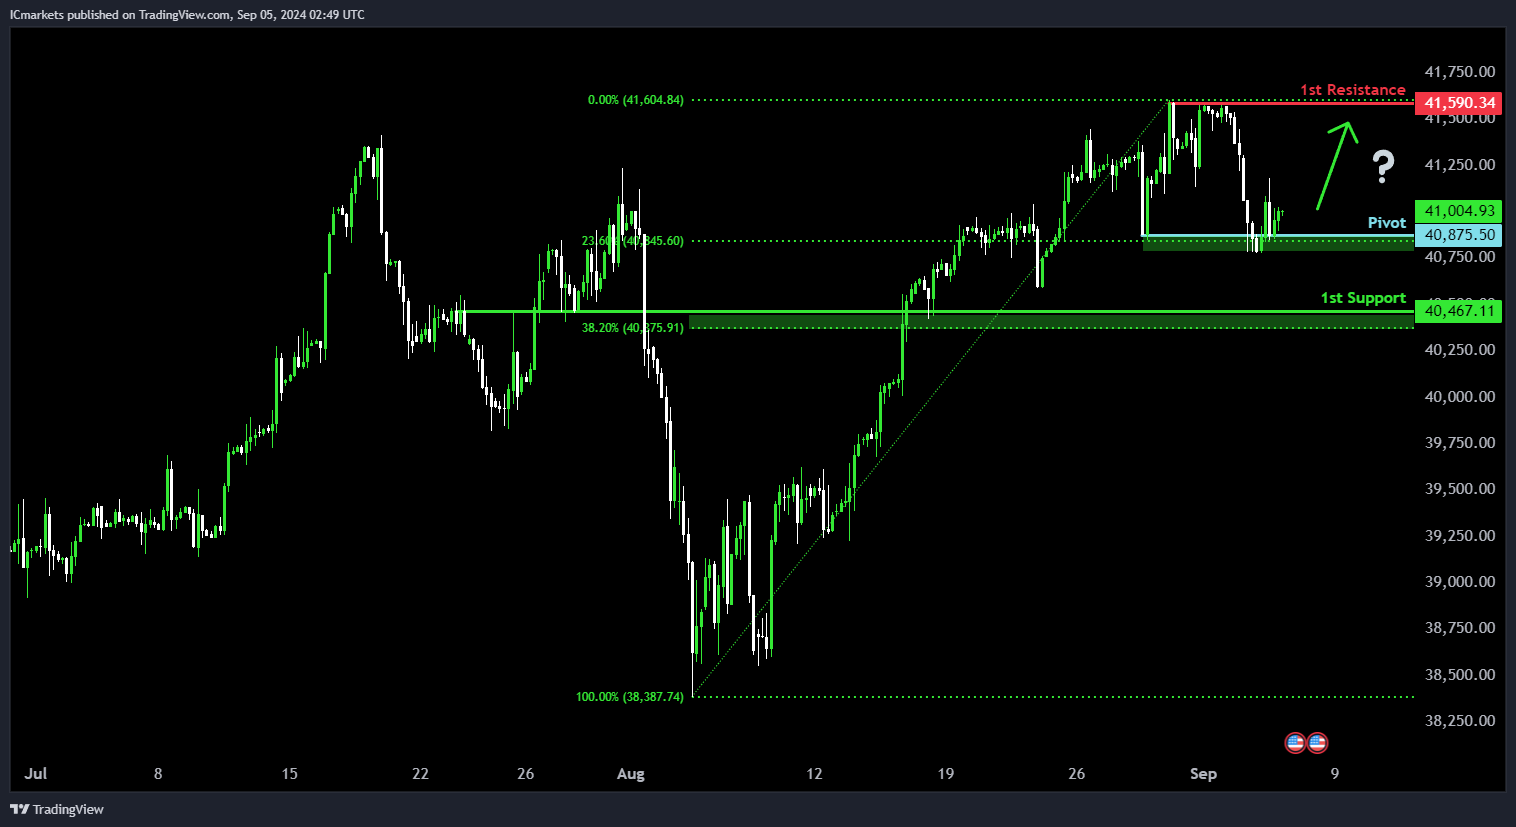
US30 (DJIA):
Potential Direction: Bullish
Overall Momentum of the Chart: Bearish
Price has stabilized around the pivot and could potentially make a bullish bounce off this level to rise towards the 1st resistance.
Pivot: 40,875.50
Supporting reasons: Identified as a multi-swing-low support that aligns with a 23.6% Fibonacci retracement, suggesting a potential area where buying interests could pick up to stage a rebound.
1st Support: 40,467.11
Supporting Reasons: Identified as an overlap support that aligns close to a 38.2% Fibonacci retracement, suggesting an area where price could find support.
1st Resistance: 41,590.34
Supporting Reasons: Identified as a swing-high resistance that aligns close to the all-time high, indicating a significant area that could halt further upward movement.
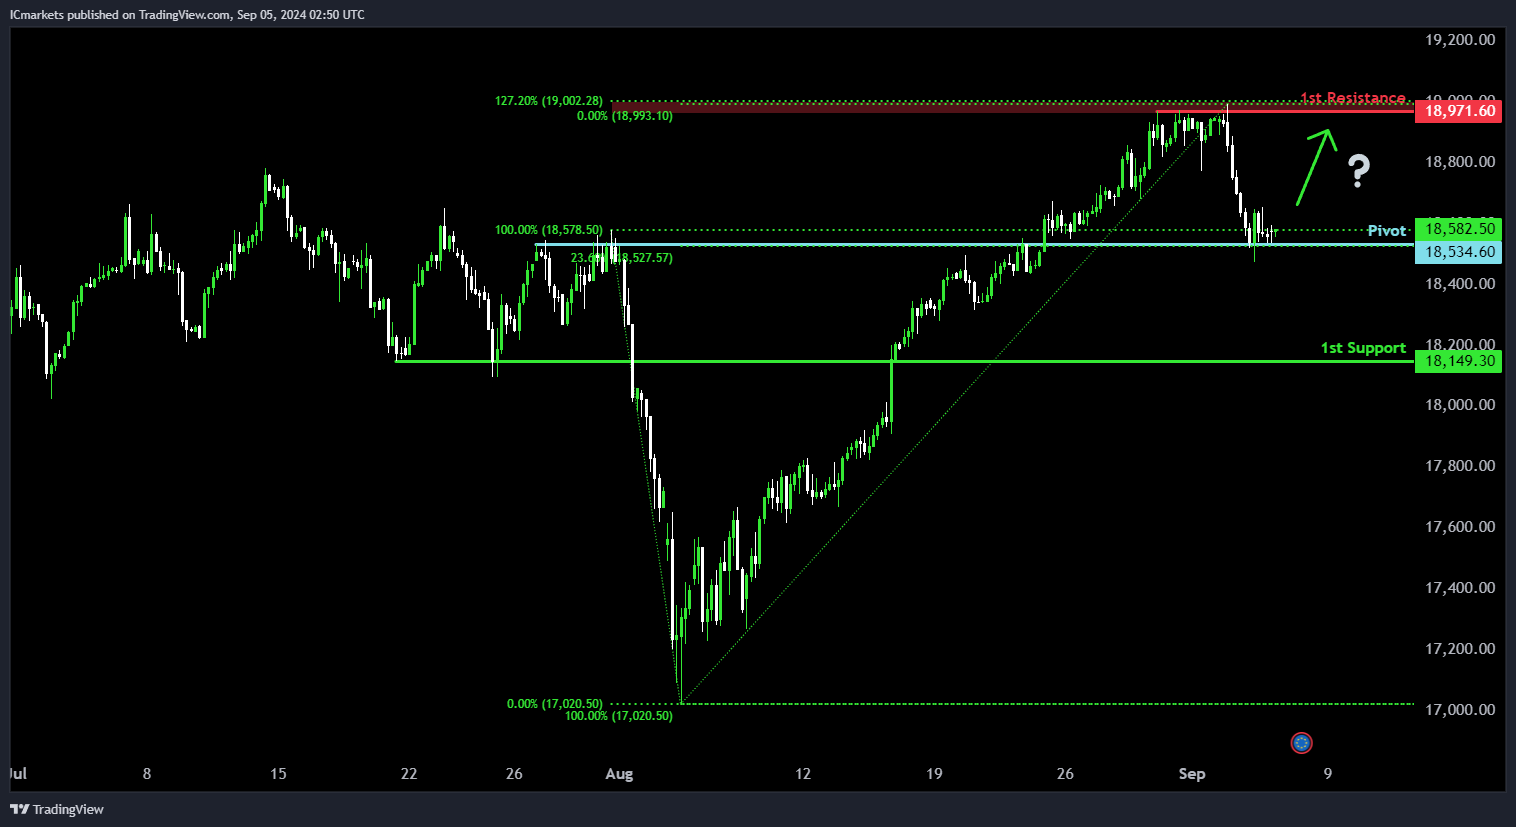
DE40 (DAX):
Potential Direction: Bullish
Overall Momentum of the Chart: Bearish
Price has stabilized around the pivot and could potentially make a bullish bounce off this level to rise towards the 1st resistance.
Pivot: 18,534.60
Supporting reasons: Identified as an overlap support that aligns with a 23.6% Fibonacci retracement, suggesting a potential area where buying interests could pick up to stage a rebound.
1st Support: 18,149.30
Supporting Reasons: Identified as a multi-swing-low support, indicating a potential area where price could find support.
1st Resistance: 18,971.60
Supporting Reasons: Identified as a swing-high resistance that aligns close to the all-time high, indicating a significant area that could halt further upward movement.
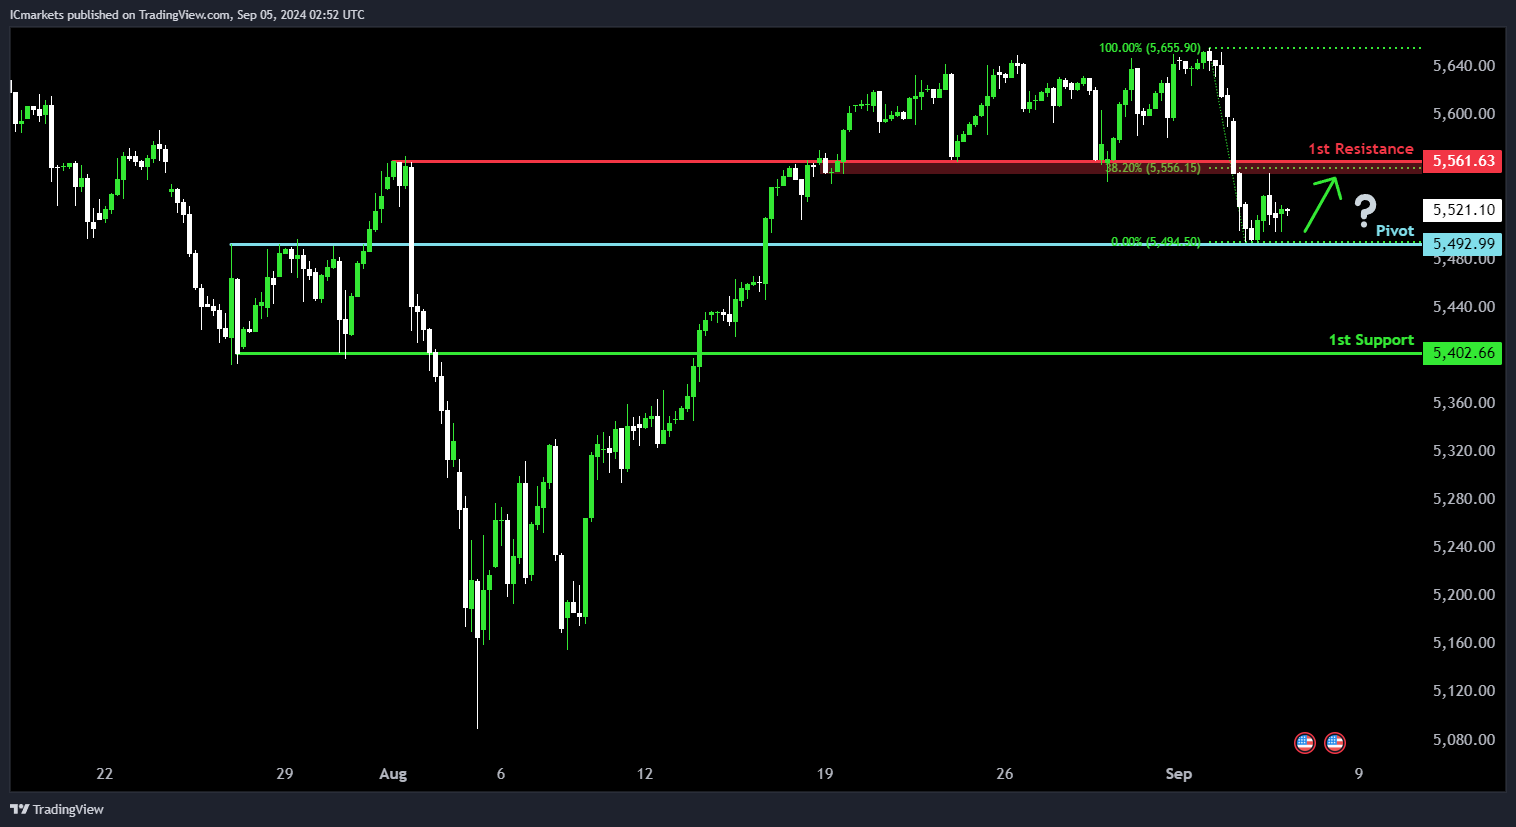
US500 (S&P 500):
Potential Direction: Bullish
Overall Momentum of the Chart: Bearish
Price could fall towards the pivot and potentially make a bullish bounce off this level to rise towards the 1st resistance.
Pivot: 5,492.99
Supporting reasons: Identified as an overlap support, suggesting a potential area where buying interests could pick up to stage a rebound.
1st support: 5,402.66
Supporting reasons: Identified as a multi-swing-low support, suggesting a potential area where price could find support.
1st resistance: 5,561.63
Supporting reasons: Identified as an overlap resistance that aligns with a 38.2% Fibonacci retracement, suggesting a critical area that could halt further upward movement.
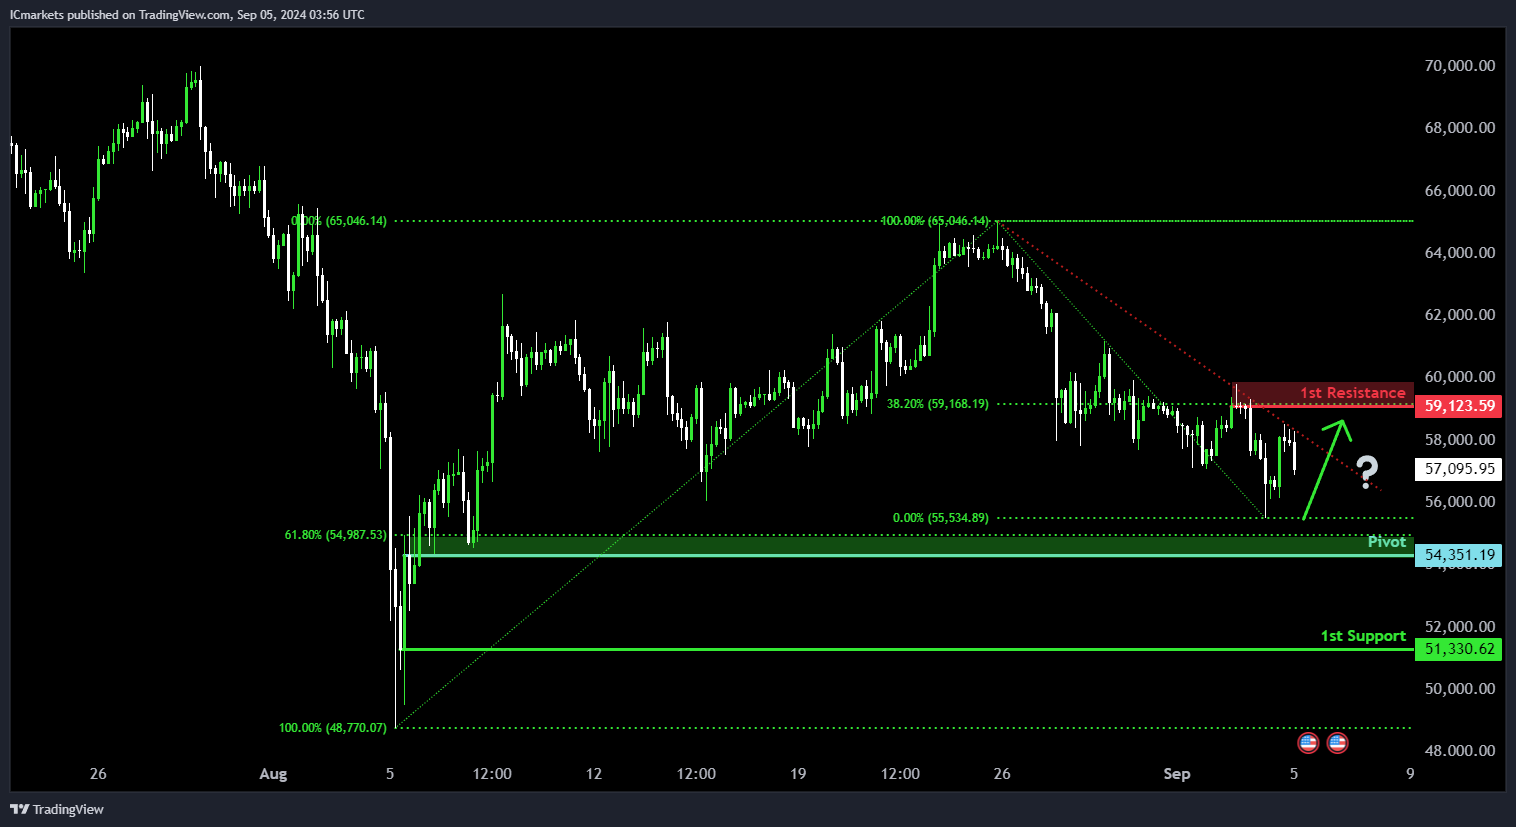
BTC/USD (Bitcoin):
Potential Direction: Bullish
Overall momentum of the chart: Neutral
Price is falling towards the pivot and could potentially make a bullish bounce off this level to rise towards the 1st resistance.
Pivot: 54,351.19
Supporting reasons: Identified as an overlap support that aligns close to a 61.8% Fibonacci retracement, indicating a potential area where buying interests could pick up to stage a rebound.
1st support: 51,330.62
Supporting reasons: Identified as a swing-low support, indicating a significant area where price has found support in the past.
1st resistance: 59,123.59
Supporting reasons: Identified as a swing-high resistance that aligns with a 38.2% Fibonacci retracement, indicating a potential barrier that could halt further upward movement.
ETH/USD (Ethereum):
Potential Direction: Bullish
Overall momentum of the chart: Neutral
Price is falling towards the pivot and could potentially make a bullish bounce off this level to rise towards the 1st resistance.
Pivot: 2,289.04
Supporting reasons: Identified as a multi-swing-low support that aligns close to a 61.8% Fibonacci retracement, indicating a potential area where buying interests could pick up to stage a rebound.
1st Support: 2,044.47
Supporting Reasons: Identified as a swing-low support, indicating a potential area where price could find support.
1st Resistance: 2,567.16
Supporting Reasons: Identified as an overlap resistance that aligns close to a 50% Fibonacci retracement, indicating a historical barrier where that could halt further upward movement.

WTI/USD (Oil):
Potential Direction: Bullish
Overall Momentum of the Chart: Bearish
Price could fall towards the pivot and potentially make a bullish bounce off this level to rise towards the 1st resistance.
Pivot: 69.83
Supporting Reasons: Identified as a multi-swing-low support, suggesting a potential area where buying interests could pick up to stall the decline.
1st Support: 68.29
Supporting Reasons: Identified as a swing-low support, indicating a potential area where price has found support in the past.
1st Resistance: 72.61
Supporting Reasons: Identified as a pullback resistance that aligns with a 38.2% Fibonacci retracement, indicating a potential barrier that could halt further upward movement.

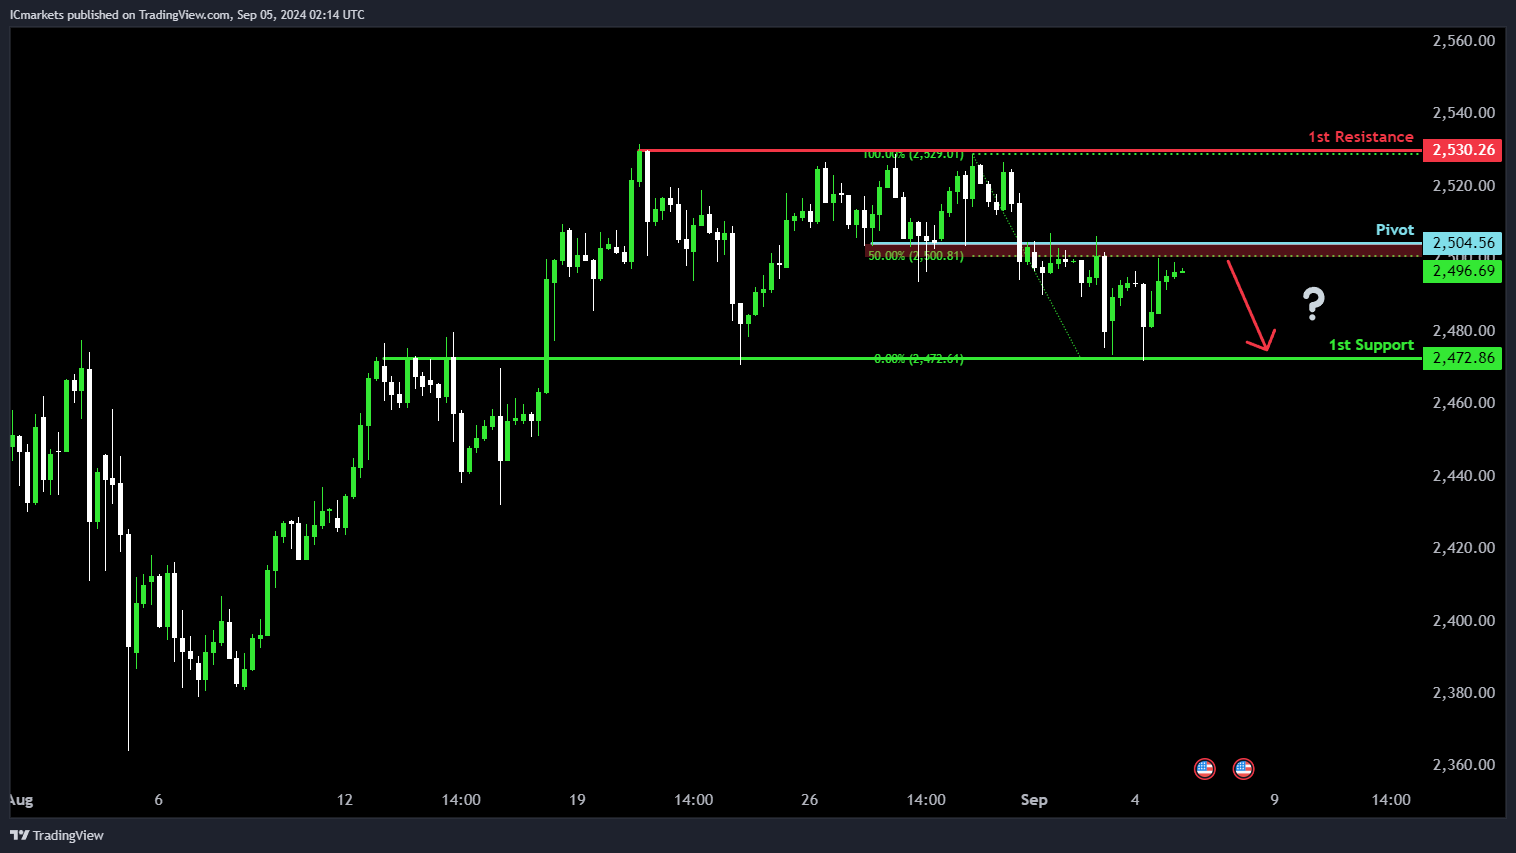
XAU/USD (GOLD):
Potential Direction: Bearish
Overall momentum of the chart: Bearish
Price could potentially make a bearish reaction off the pivot and drop to the 1st support.
Pivot: 2505.56
Supporting reasons: An overlap resistance, aligned with the 50% Fibonacci Retracement, indicating potential selling pressure at this level.
1st support: 2472.86
Supporting reasons: An overlap support, marking a significant area where previous declines have found support.
1st resistance: 2530.26
Supporting reasons: Multi-swing high resistance, suggesting a potential area where the price may face resistance after rallies.
The accuracy, completeness and timeliness of the information contained on this site cannot be guaranteed. IC Markets does not warranty, guarantee or make any representations, or assume any liability regarding financial results based on the use of the information in the site.
News, views, opinions, recommendations and other information obtained from sources outside of www.icmarkets.com, used in this site are believed to be reliable, but we cannot guarantee their accuracy or completeness. All such information is subject to change at any time without notice. IC Markets assumes no responsibility for the content of any linked site.
The fact that such links may exist does not indicate approval or endorsement of any material contained on any linked site. IC Markets is not liable for any harm caused by the transmission, through accessing the services or information on this site, of a computer virus, or other computer code or programming device that might be used to access, delete, damage, disable, disrupt or otherwise impede in any manner, the operation of the site or of any user’s software, hardware, data or property.