Traders are preparing for a busy end to the week as the crucial US employment data is set to provide the final insight that could determine the size of the Federal Reserve’s rate cut. The likelihood of a 50-basis point cut has been rising throughout the week, as some of the smaller job updates have indicated a slowdown in the labour market. If the data disappoints tonight, expectations for a larger cut may increase significantly.
The headline Non-Farm Employment Change figure is anticipated to show a 164,000 increase, with the Unemployment Rate expected to dip by 0.1% to 4.2%, and Average Hourly Earnings forecast to rise by 0.3% on a monthly basis. Traders are poised for significant market movement, particularly if the data deviates from these projections. Many are closely watching the USD/JPY level, as this release could signal the beginning of a longer-term interest rate differential trade, with the FOMC and the Bank of Japan pursuing divergent monetary policies.
The Bank of Japan has already embarked on its rate-hiking cycle, and there is a strong expectation in Tokyo for at least two more hikes by the end of the year. On the US side, markets have priced in a 100-basis point cut from the Federal Reserve, but a weaker employment number could push this to 125 basis points. This scenario would likely set the stage for a stronger downward move in USD/JPY.
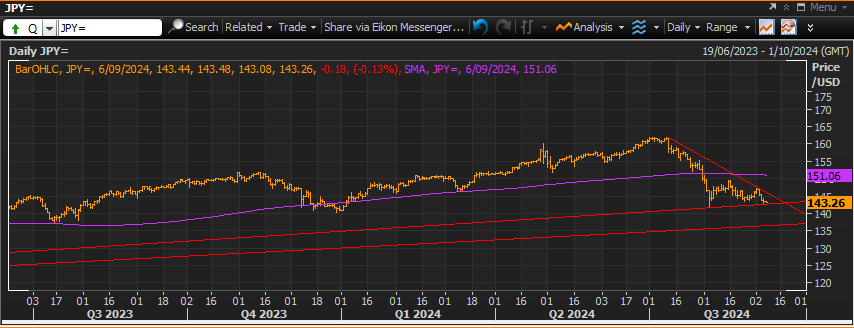
Currently, USD/JPY is sitting just above strong long-term trendline support on the daily chart, close to the recent low from early August when the pair experienced a sharp decline. A weaker US jobs report could break these levels, paving the way for a much deeper correction as we head into year-end. The initial target would be the next trendline support around 136.50, but if US data continues to disappoint, this move could extend even further. Conversely, a stronger jobs figure would likely lock in a 25-basis point cut from the Fed and trigger a short-term recovery in USD/JPY, with initial resistance around the 146.00 level on the daily chart. However, many traders view any rally as an opportunity to sell, continuing the sharp downward trend seen since mid-July.
Resistance 2: 149.39 – August 15 High
Resistance 1: 146.00 – Trendline Resistance
Support 1: 142.70 – Trendline Support
Support 2: 136.47 – Long-Term Trendline Support