DXY (US Dollar Index):
Potential Direction: Bullish
Overall momentum of the chart: Bearish
Factors contributing to the momentum: The bearish overall momentum contrasts with the potential for a bullish bounce.
Price could potentially make a: Bullish bounce off pivot and head towards 1st resistance.
Pivot: 100.52
Supporting reasons: Swing high resistance, indicating a level where the price could reverse.
1st support: 100.24
Supporting reasons: 127.20% Fibonacci Extension, suggesting a key support level where price might find buying interest.
1st resistance: 101.26
Supporting reasons: Pullback resistance, 61.80% Fibonacci Retracement, indicating a strong level where price could face resistance if it moves upward.

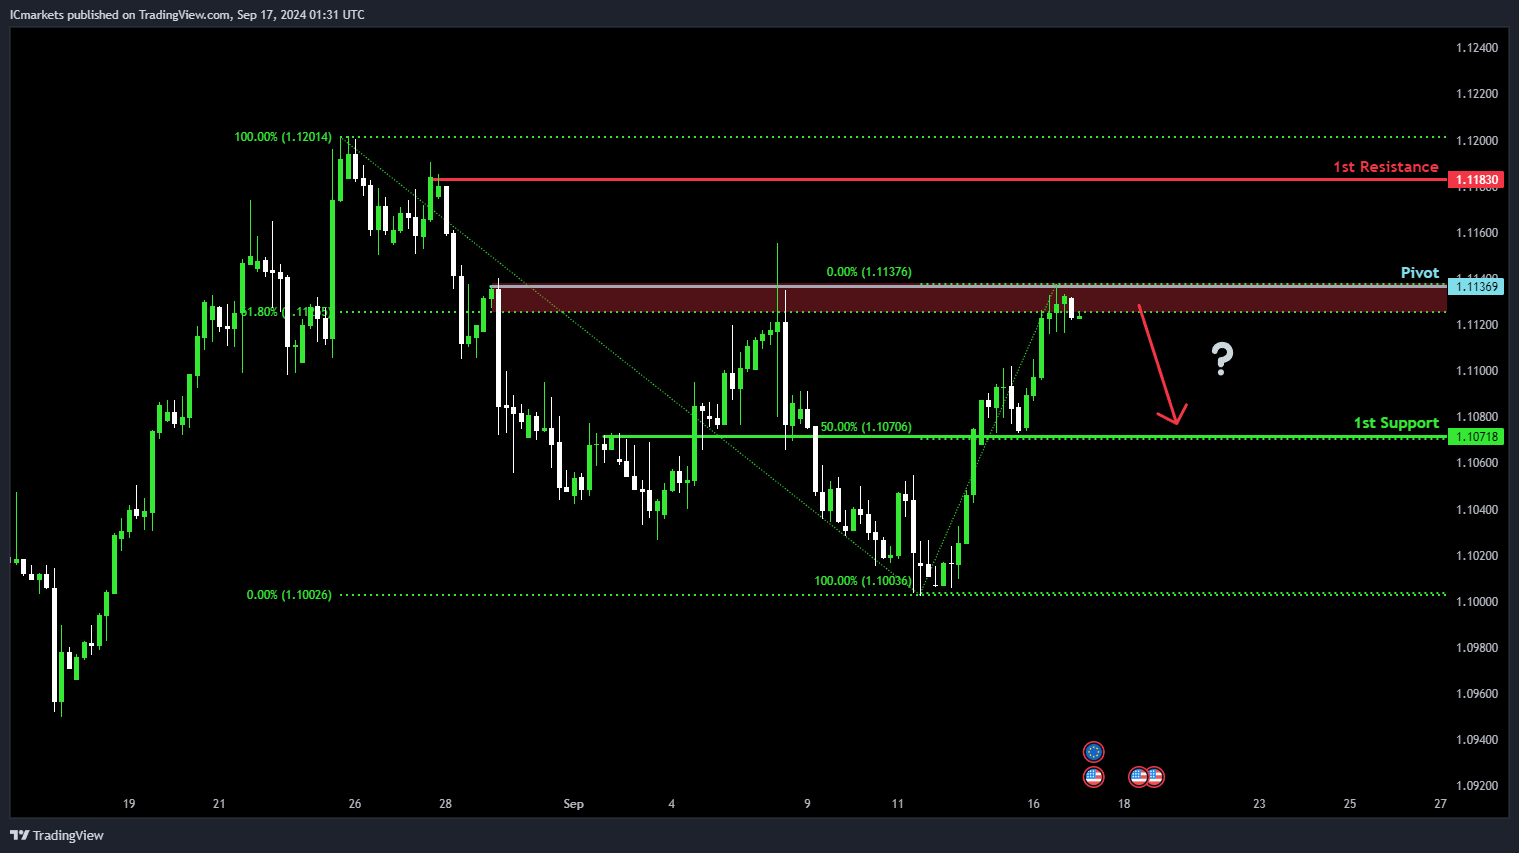
EUR/USD:
Potential Direction: Bearish
Overall momentum of the chart: Bullish
Price could potentially make a bearish reaction off pivot and drop to 1st support.
Pivot: 1.1136
Supporting reasons: An overlap resistance, with 61.8% Fibonacci Retracement which may provide a significant level for a bearish reaction.
1st support: 1.1071
Supporting reasons: An overlap support with 50% Fibonacci Retracement, indicating a potential area where the price may find support if it drops.
1st resistance: 1.1183
Supporting reasons: Swing high resistance, which may be a key level if the price moves higher.
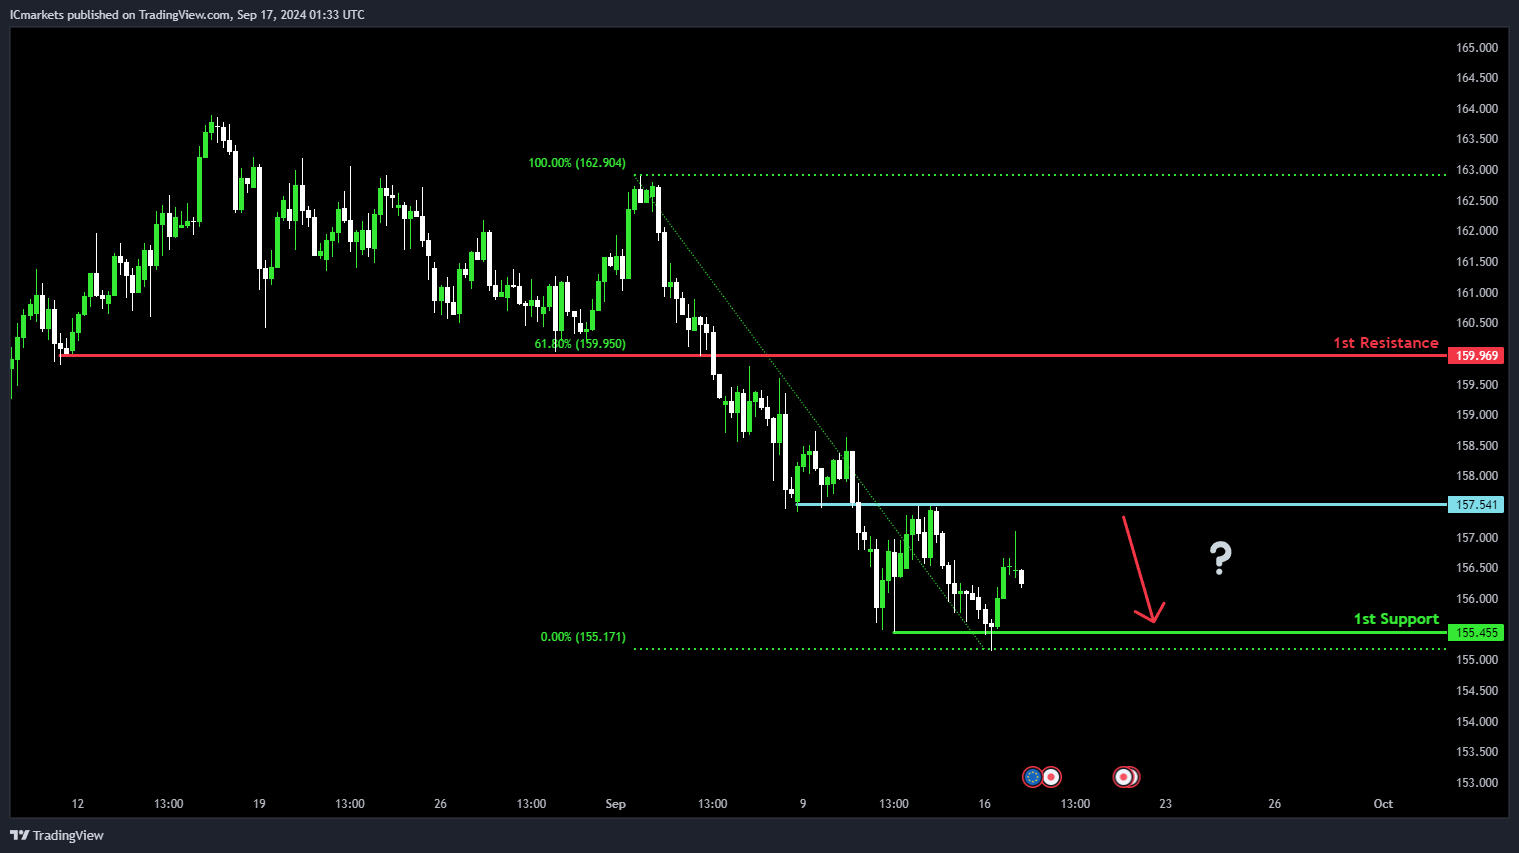
EUR/JPY:
Potential Direction: Bearish
Overall momentum of the chart: Bearish
Factors contributing to the momentum: The bearish overall momentum aligns with the potential for a bearish reaction.
Price could potentially make a: Bearish reaction off pivot and drop to 1st support.
Pivot: 157.54
Supporting reasons: An Overlap resistance, indicating a level where the price could face selling pressure.
1st support: 155.45
Supporting reasons: Swing low support, suggesting a significant level where the price might find buying interest if it drops.
1st resistance: 159.96
Supporting reasons: Pullback resistance, 61.80% Fibonacci Retracement, indicating a strong level where price could face resistance if it moves up.
EUR/GBP:
Potential Direction: Bearish
Overall momentum of the chart: Bearish
Factors contributing to the momentum: The bearish overall momentum aligns with the potential for a bearish reaction.
Price could potentially make a: Bearish reaction off pivot and drop to 1st support.
Pivot: 0.8430
Supporting reasons: Pullback resistance, indicating a potential resistance level where selling pressure might emerge.
1st support: 0.8400
Supporting reasons: Swing low support, a significant level where buying interest might be expected if the price falls.
1st resistance: 0.8454
Supporting reasons: An Overlap resistance and 23.60% Fibonacci Retracement, suggesting that this level could act as resistance if the price moves upward.

GBP/USD:
Potential Direction: Bearish
Overall momentum of the chart: Bearish
Factors contributing to the momentum: The bearish overall momentum aligns with the potential for a bearish reaction.
Price could potentially make a: Bearish reaction off pivot and drop to 1st support.
Pivot: 1.3182
Supporting reasons: An Overlap resistance and 61.80% Fibonacci Projection, indicating this level might act as resistance where the price could potentially reverse.
1st support: 1.3104
Supporting reasons: An Overlap support and 50% Fibonacci Retracement, suggesting this level could provide support if the price drops.
1st resistance: 1.3303
Supporting reasons: 127.20% Fibonacci Extension, indicating potential resistance if the price moves upward.

GBP/JPY:
Potential Direction: Bearish
Overall momentum of the chart: Bearish
Factors contributing to the momentum: The overall bearish momentum suggests a continuation in the same direction.
Price could potentially make a: Bearish continuation towards 1st support.
Pivot: 186.65
Supporting reasons: An Overlap resistance, indicating this level might act as a barrier for price movement.
1st support: 183.74
Supporting reasons: Swing low support, suggesting this level could hold as support if the price declines.
1st resistance: 189.28
Supporting reasons: An Overlap resistance and 61.80% Fibonacci Retracement, indicating this level might act as resistance if the price moves upward.

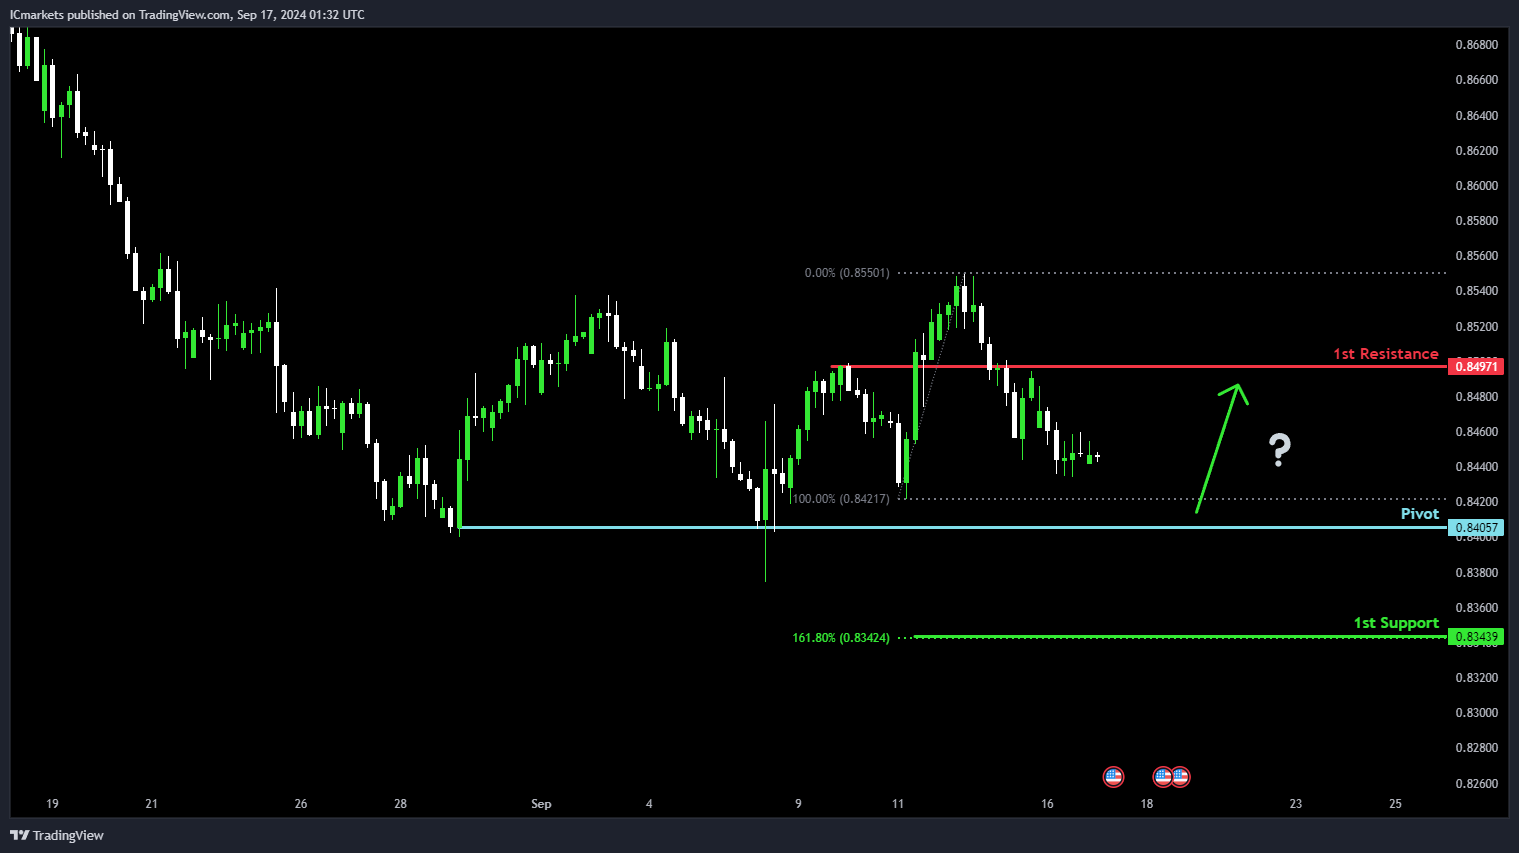
USD/CHF:
Potential Direction: Bullish
Overall momentum of the chart: Bullish
Factors contributing to the momentum: The bullish momentum suggests the price may continue in an upward direction.
Price could potentially make a: Bullish bounce off pivot and heads towards 1st resistance.
Pivot: 0.8405
Supporting reasons: Swing low support, indicating this level may act as a support if the price pulls back.
1st support: 0.8343
Supporting reasons: 161.80% Fibonacci Extension, suggesting strong support at this level.
1st resistance: 0.8497
Supporting reasons: An Overlap resistance, indicating potential resistance if the price rises.
USD/JPY:
Potential Direction: Bearish
Overall momentum of the chart: Bearish
Factors contributing to the momentum: The bearish momentum suggests a continuation of the downtrend.
Price could potentially make a: Bearish reaction off pivot and drop to 1st support.
Pivot: 141.77
Supporting reasons: Pullback resistance, with 61.80% Fibonacci Retracement indicating this level could act as resistance if the price retraces.
1st support: 139.62
Supporting reasons: Swing low support, suggesting this level might hold as support if the price moves downward.
1st resistance: 143.70
Supporting reasons: An Overlap resistance, with 50% Fibonacci Retracement indicating potential resistance if the price rises.

USD/CAD:
Potential Direction: Bullish
Overall momentum of the chart: Neutral
Price is falling towards the pivot and could potentially make a bullish bounce off this level to rise towards the 1st resistance.
Pivot: 1.3549
Supporting reasons: Identified as an overlap support that aligns with a 38.2% Fibonacci retracement, suggesting a potential area where buying interests could pick up to stage a minor rebound.
1st support: 1.3492
Supporting reasons: Identified as a swing-low support that aligns close to a 61.8% Fibonacci retracement, indicating a key level where price has found strong support in the past.
1st resistance: 1.3615
Supporting reasons: Identified as an overlap resistance that aligns close to a 38.2% Fibonacci retracement, indicating a potential area that could halt any further upward movement.

AUD/USD:
Potential Direction: Bearish
Overall momentum of the chart: Neutral
Price could rise towards the pivot and potentially reverse off this level to drop towards the 1st support.
Pivot: 0.6813
Supporting reasons: Identified as a swing-high resistance, suggesting a potential level where selling interests could intensify.
1st support: 0.6685
Supporting reasons: Identified as an overlap support, indicating a key level where price has recently found support.
1st resistance: 0.6859
Supporting reasons: Identified as a swing-high resistance that aligns close to a 127.2% Fibonacci extension, indicating a potential area that could halt any further upward movement.

NZD/USD
Potential Direction: Bearish
Overall momentum of the chart: Neutral
Price could rise towards the pivot and potentially reverse off this level to drop towards the 1st support.
Pivot: 0.6236
Supporting reasons: Identified as an overlap resistance that aligns close to a 61.8% Fibonacci retracement, suggesting a potential level where selling interests could intensify.
1st support: 0.6155
Supporting reasons: Identified as an overlap support, indicating a potential level where price has found strong support in the past.
1st resistance: 0.6292
Supporting reasons: Identified as a swing-high resistance, indicating a potential area that could halt any further upward movement.

US30 (DJIA):
Potential Direction: Bullish
Overall momentum of the chart: Neutral
Price is falling towards the pivot and could potentially make a bullish bounce off this level to rise towards the 1st resistance.
Pivot: 41,056.42
Supporting reasons: Identified as a pullback support that aligns with a 38.2% Fibonacci retracement, suggesting a potential area where buying interests could pick up to resume the uptrend.
1st support: 40,704.12
Supporting reasons: Identified as a pullback support that aligns with a 61.8% Fibonacci retracement, indicating a key level where price has found support recently.
1st resistance: 41,992.28
Supporting reasons: Identified as a resistance that aligns with a 61.8% Fibonacci projection, indicating a potential area that could halt any further upward movement.

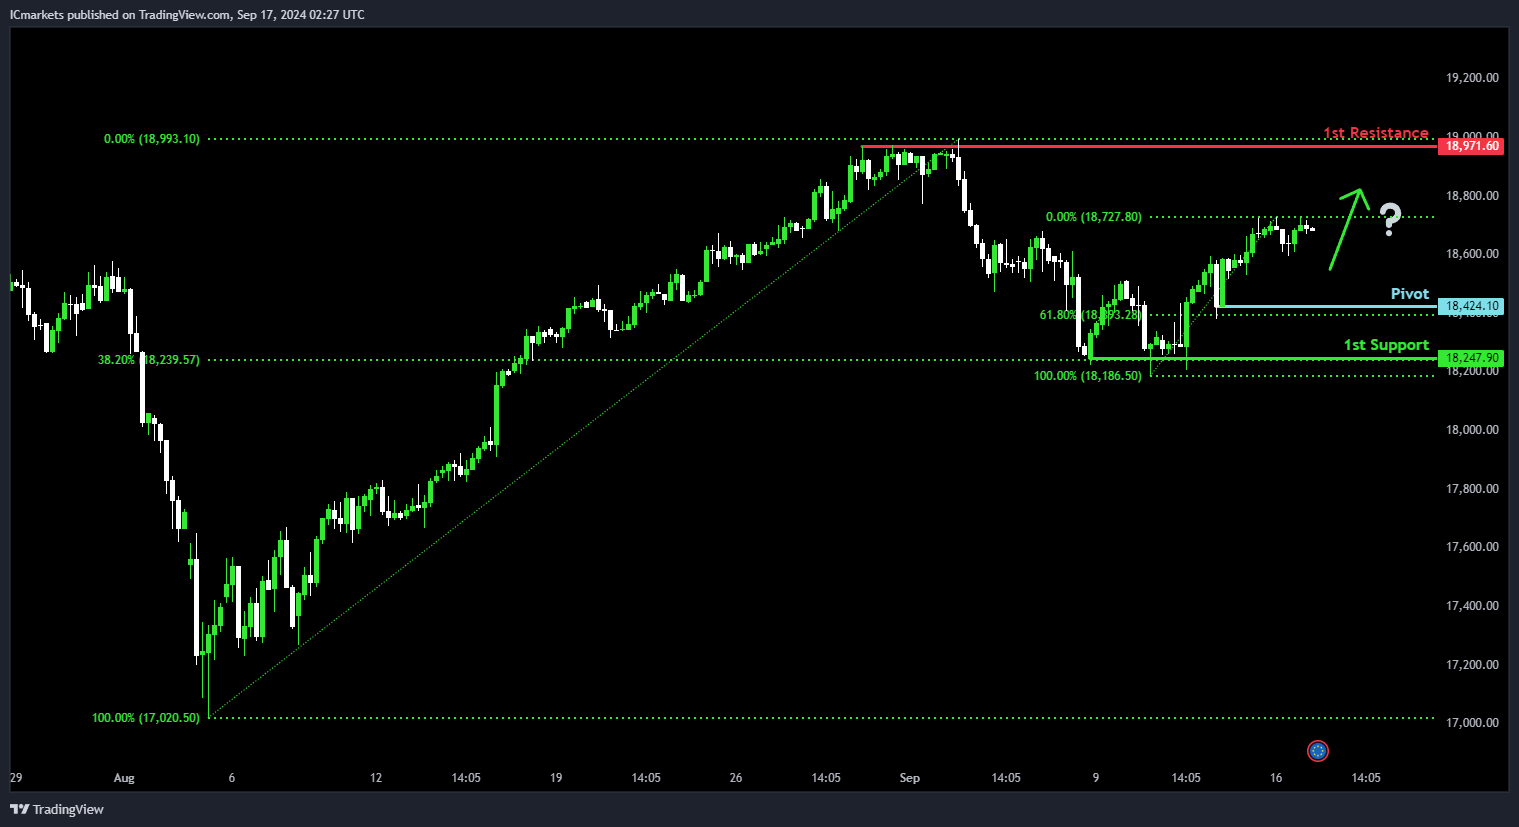
DE40 (DAX):
Potential Direction: Bullish
Overall momentum of the chart: Neutral
Price is falling towards the pivot and could potentially make a bullish bounce off this level to rise towards the 1st resistance.
Pivot: 18,424.10
Supporting reasons: Identified as a pullback support that aligns with a 61.8% Fibonacci retracement, suggesting a potential area where buying interests could pick up to resume the uptrend.
1st support: 18,247.90
Supporting reasons: Identified as a multi-swing-low support that aligns with a 38.2% Fibonacci retracement, indicating a key level where price has found support recently.
1st resistance: 18,971.60
Supporting reasons: Identified as a swing-high resistance that aligns close to the all-time high, indicating a potential area that could halt any further upward movement.
US500 (S&P 500):
Potential Direction: Bullish
Overall momentum of the chart: Neutral
Price is falling towards the pivot and could potentially make a bullish bounce off this level to rise towards the 1st resistance.
Pivot: 5,544.60
Supporting reasons: Identified as an overlap support that aligns with a 38.2% Fibonacci retracement, suggesting a potential area where buying interests could pick up to resume the uptrend.
1st support: 5,385.30
Supporting reasons: Identified as a swing-low support that aligns close to a 50% Fibonacci retracement, indicating a key level where price has found support recently.
1st resistance: 5,669.89
Supporting reasons: Identified as a swing-high resistance that aligns close to the all-time high, indicating a potential area that could halt any further upward movement.

BTC/USD (Bitcoin):
Potential Direction: Bullish
Overall momentum of the chart: Neutral
Price is falling towards the pivot and could potentially make a bullish bounce off this level to rise towards the 1st resistance.
Pivot: 56,576.60
Supporting reasons: Identified as an overlap support that aligns with a 50% Fibonacci retracement, suggesting a potential level where buying interests could pick up to stage a rebound.
1st support: 53,477.38
Supporting reasons: Identified as a swing-low support, indicating a key level where price has found strong in the past.
1st resistance: 60,783.25
Supporting reasons: Identified as a multi-swing-high resistance, indicating a potential area that could halt any further upward movement.

ETH/USD (Ethereum):
Potential Direction: Bullish
Overall momentum of the chart: Neutral
Price is falling towards the pivot and could potentially make a bullish bounce off this level to rise towards the 1st resistance.
Pivot: 2,218.93
Supporting reasons: Identified as a swing-low support that aligns with a 78.6% Fibonacci retracement, suggesting a potential level where buying interests could pick up to stage a rebound.
1st support: 2,044.47
Supporting reasons: Identified as a swing-low support, indicating a potential level where price has found support in the past.
1st resistance: 2,454.11
Supporting reasons: Identified as a multi-swing-high resistance that aligns close to a 50% Fibonacci retracement, indicating a potential area that could halt any further upward movement.

WTI/USD (Oil):
Potential Direction: Bearish
Overall momentum of the chart: Neutral
Price is rising towards the pivot and could potentially make a bearish reversal off this level to fall towards the 1st support.
Pivot: 72.61
Supporting reasons: Identified as a pullback resistance that aligns close to a 50% Fibonacci retracement, suggesting a potential level where selling pressures could intensify.
1st support: 68.91
Supporting reasons: Identified as an overlap support, indicating a key level where price has recently found support.
1st resistance: 75.38
Supporting reasons: Identified as an overlap resistance that aligns close to a 78.6% Fibonacci retracement, indicating a potential area that could halt any further upward movement.

XAU/USD (GOLD):
Potential Direction: Bearish
Overall momentum of the chart: Bullish
Price could potentially make a: Bearish reaction off pivot and drop to 1st support.
Pivot: 2583.95
Supporting reasons: 61.80% Fibonacci Projection, indicating this level might act as resistance if the price retraces.
1st support: 2531.45
Supporting reasons: Pullback support, suggesting this level could hold as support if the price drops.
1st resistance: 2613.19
Supporting reasons: 78.60% Fibonacci Projection, indicating potential resistance if the price rises further.

The accuracy, completeness and timeliness of the information contained on this site cannot be guaranteed. IC Markets does not warranty, guarantee or make any representations, or assume any liability regarding financial results based on the use of the information in the site.
News, views, opinions, recommendations and other information obtained from sources outside of www.icmarkets.com, used in this site are believed to be reliable, but we cannot guarantee their accuracy or completeness. All such information is subject to change at any time without notice. IC Markets assumes no responsibility for the content of any linked site.
The fact that such links may exist does not indicate approval or endorsement of any material contained on any linked site. IC Markets is not liable for any harm caused by the transmission, through accessing the services or information on this site, of a computer virus, or other computer code or programming device that might be used to access, delete, damage, disable, disrupt or otherwise impede in any manner, the operation of the site or of any user’s software, hardware, data or property.