One of the most basic foundations of technical analysis is watching price charts. There are three popular types of charts used by forex traders and these are line charts, bar or open-high-low-close charts, and candlestick charts.
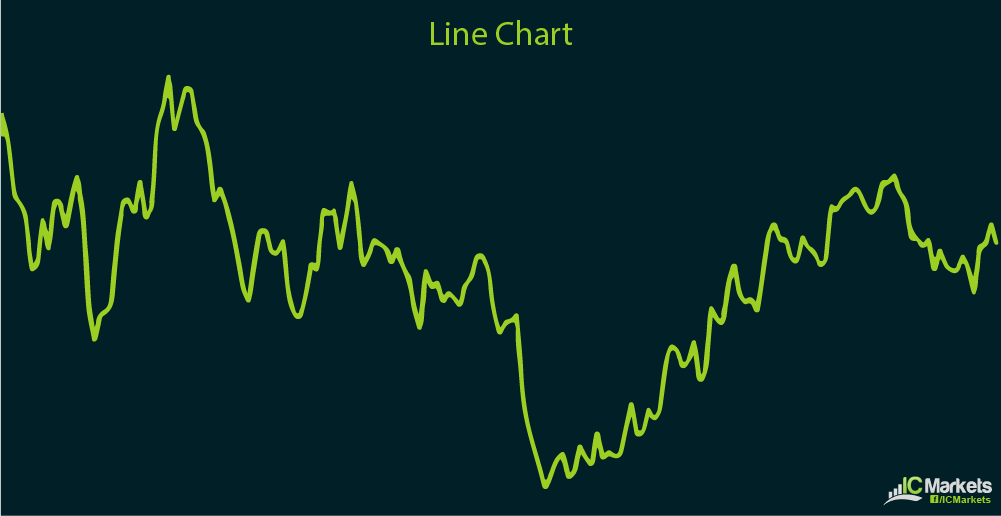
The line chart is the simplest among the three, with a price line connecting one closing price to the next. This allows the trader to gauge the general direction of price action, whether the exchange rate is trending higher or lower.
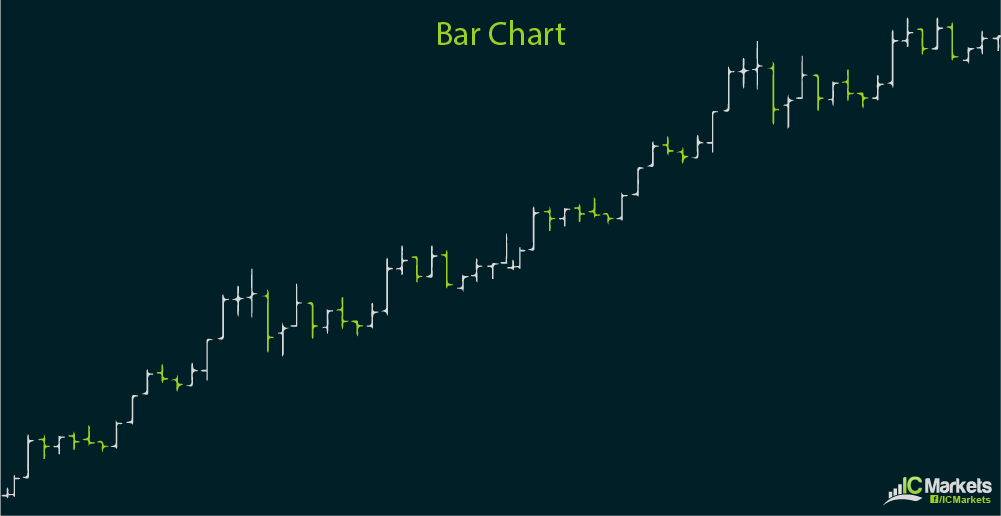
The bar chart, which is also called the OHLC (open, high, low, close) chart, is a little more complex. Each bar notates the open, high, low, and close of the price depending on the time frame used.
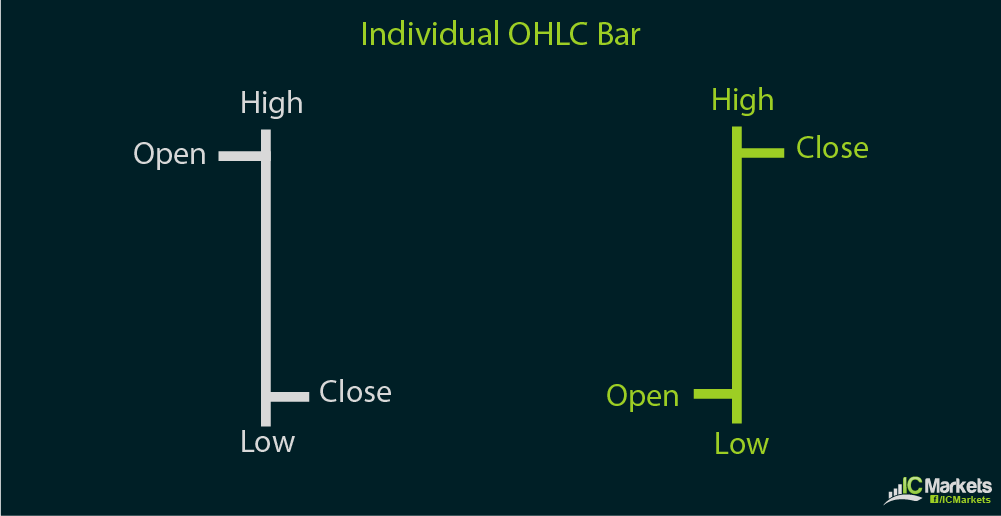
Zooming in to each bar, the horizontal line to the left marks the open price for the period while the horizontal line to the right marks the closing price. The highest point of each bar stands for the high for the period while the lowest point is for the low.
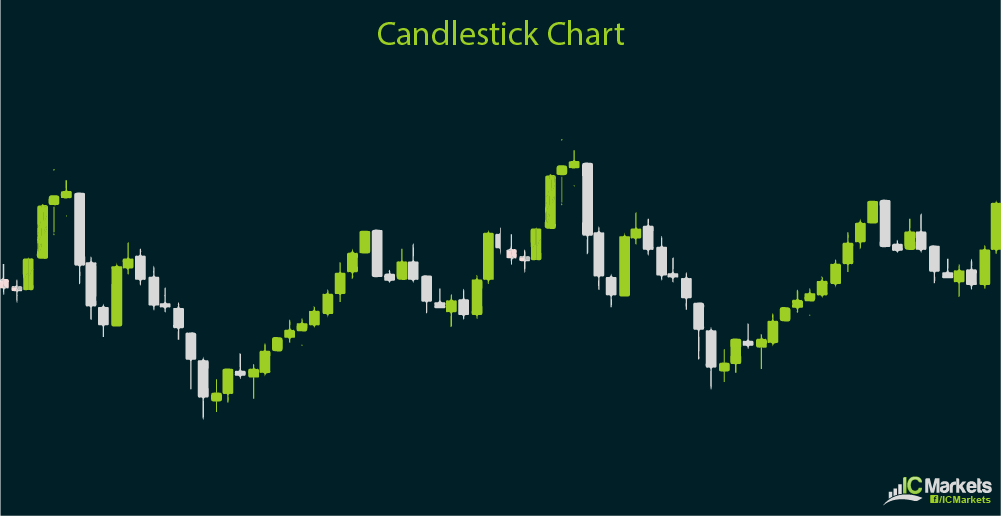
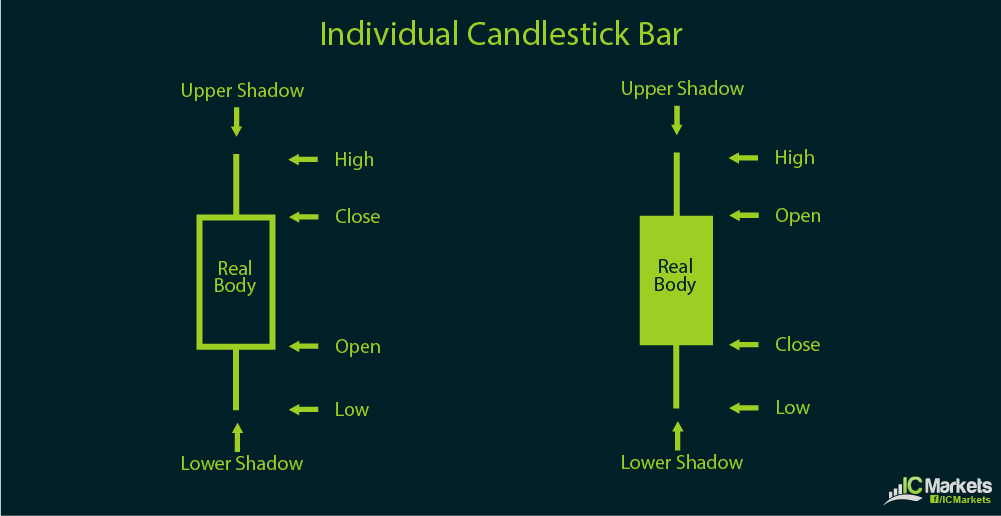
Lastly, the Candlestick chart is the most commonly used by forex traders. Similar to the OHLC chart, candlesticks also indicate the open, high, low, and close of price action during the period.
What sets candlestick charts apart is that the bars have a colored body, which makes it easier to visualize whether price went up or down during the period. When price closed higher than its open price for the period, the candlestick is colored white or green. When price closed lower than its open price for the period, the candlestick is colored black or red. This way, forex traders can get a clearer idea of whether buying or selling pressure is building up.
In addition to providing a quick snapshot of bullish or bearish momentum, Japanese candlesticks also have formations that act as reversal or continuation signals. These formations can come in individual candlestick patterns or in groups of two or three. Candlestick patterns, which are also a major component of modern technical analysis, are covered in the next section.

