Key risk events today:
US PPI m/m.
(Previous analysis as well as outside sources – italics).
EUR/USD:
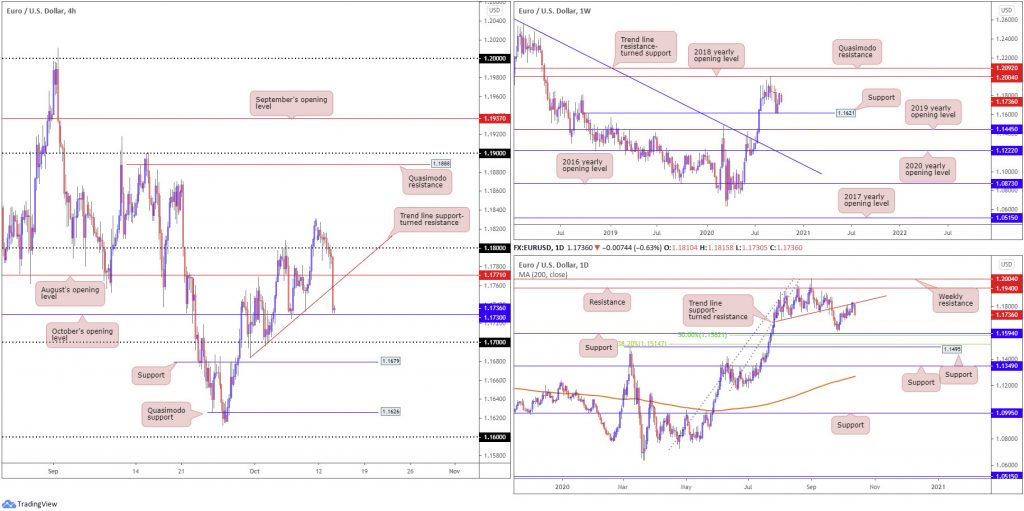
The US dollar rebounded sharply Tuesday, guiding EUR/USD into a bearish environment.
Technical price action on the H4 lost grip north of 1.18, and subsequently overthrew August’s opening value at 1.1771 and a trend line support, extended from the low 1.1684. As you can see, buyers and sellers are now wrestling for position a few points ahead of October’s opening value at 1.1730, with a break here exposing the 1.17 handle.
Higher up on the curve:
- Daily price is fading a trend line support-turned resistance, etched from the low 1.1695. A continuation to the downside from here shines the headlights on support at 1.1594 (and a 50.0% retracement ratio at 1.1582).
- Minor support on the weekly timeframe remains stationed at 1.1621, set above the 2019 yearly opening value at 1.1445. Despite Tuesday’s precipitous decline, the 2018 yearly opening value at 1.2004 still represents valid resistance.
Areas of consideration:
Any upside attempts north of October’s opening value at 1.1730 today are likely to be capped by the H4 trend line support-turned resistance/August’s opening value at 1.1771. The aforementioned zones, therefore, are potentially of interest to sellers.
Intraday bearish breakout strategies may also form in the event of a H4 close printing beneath 1.1730, targeting 1.17 as an initial point.
GBP/USD:
For those who read Tuesday’s technical briefing you may recall the following (italics):
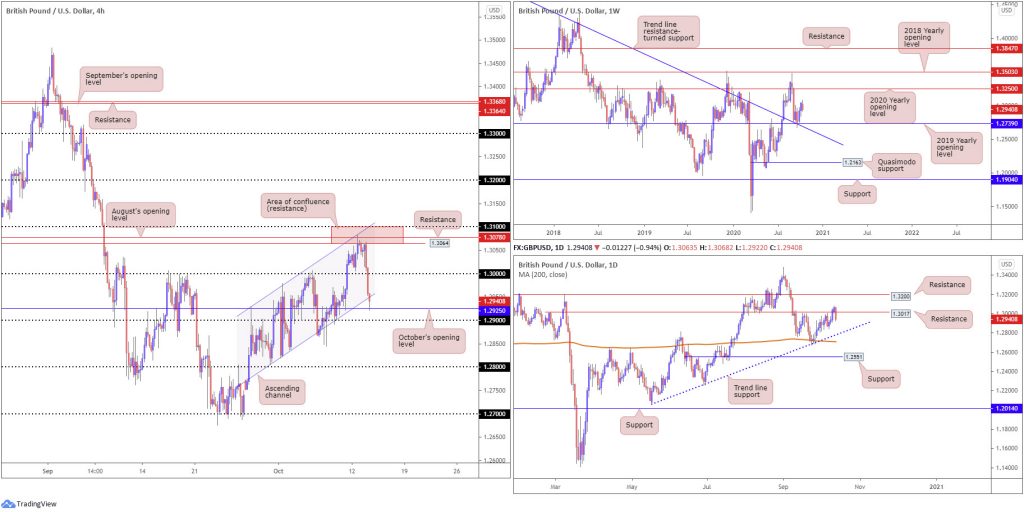
Technically, the H4 timeframe tested an interesting area of resistance between 1.31/1.3064 (red), composed of the 1.31 handle, resistance from 1.3064, August’s opening value at 1.3078 and channel resistance, drawn from the high 1.2929.
Fuelled by a healthy dollar rebound and concerns surrounding Brexit, GBP/USD declined strongly from the H4 resistance zone mentioned above at 1.31/1.3064 on Tuesday. H4 price action smothered the key figure 1.30 and snowballed towards channel support, taken from the low 1.2805, and October’s opening value at 1.2925 (set just north of 1.29).
Meanwhile, on the weekly timeframe, price still reveals room to march higher. Last week observed GBP/USD extend recent recovery gains from support at 1.2739 (a 2019 yearly opening value). Technicians will acknowledge 1.2739 blends with trend line resistance-turned support, extended from the high 1.5930. In terms of resistance, price has room to advance as far north as the 2020 yearly opening value at 1.3250.
From the daily timeframe, however, we can see the unit trading comfortably under resistance at 1.3017, consequently eyeing trend line support, extended from the low 1.2075, as a possible target.
Areas of consideration:
Between 1.29 and H4 channel support is an area buyers may be attracted to, and by extension likely to be an area sellers from 1.31/1.3064 could consider profit taking.
Should we move through 1.29, H4 breakout sellers must contend with Quasimodo support at 1.2865 before considering the possibility of follow-through moves to 1.28 (blends with daily trend line support).
AUD/USD:
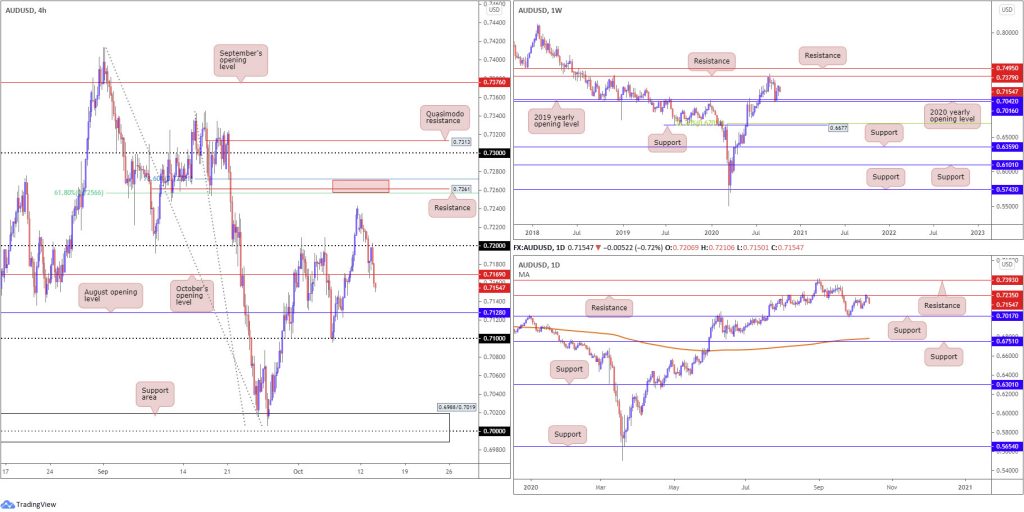
Tuesday witnessed sellers strengthen their grip amid a healthy USD bid. AUD/USD tilted beneath 0.72 in early trading on the H4, leading price to October’s opening value at 0.7169. Although the latter encouraged a modest recovery to 0.72, a bearish revival took hold and sent the currency pair to lows at 0.7150 heading into the close. Next on tap, in terms of support, is August’s opening value at 0.7128, closely followed by the 0.71 handle.
Yesterday’s bearish tone was always going to be an option, given daily price hugging the underside of a reasonably notable resistance at 0.7235. However, having seen weekly price showing room to march higher, moves north were also a possibility. As a result of recent selling, though, the 2020 (0.7016) and 2019 (0.7042) yearly opening levels applied to the weekly timeframe are logged as the next potential higher timeframe support targets.
Areas of consideration:
A H4 retest at the underside of October’s opening value at 0.7169 is one possible scenario, targeting August’s opening value at 0.7128, as well as the 0.71 handle. Follow-through selling beyond these two levels is possible until we reach 0.7042 (on the higher timeframes), sited just ahead of a H4 support area at 0.6988/0.7019.
USD/JPY:
Risk sentiment twisted south Tuesday, sparking a USD bid.
USD/JPY upside, however, was limited as the Japanese yen also likely caught a bid on safe-haven flows.
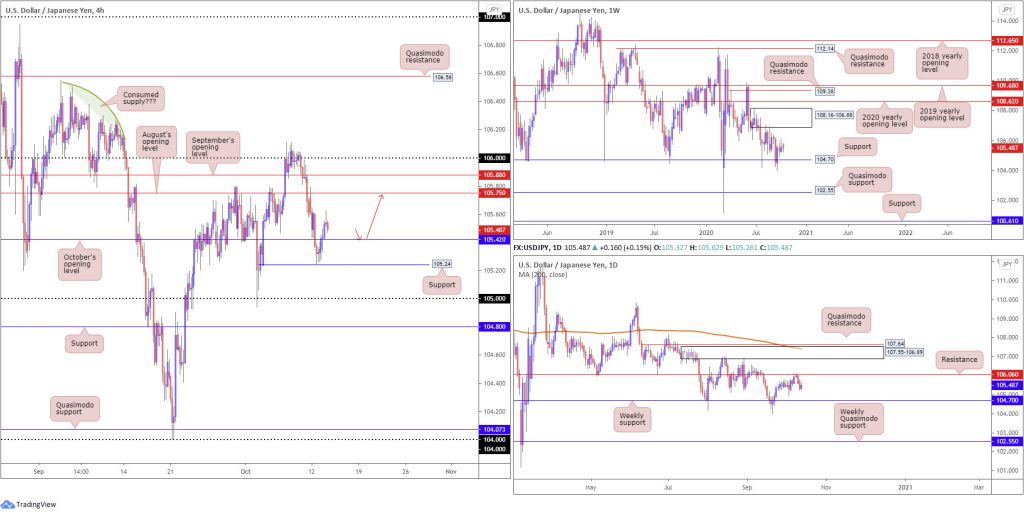
Support was found at 105.24 on the H4 timeframe, proving enough of a platform for buyers to approach territory above October’s opening value at 105.42. August and September’s opening values at 105.75 and 105.88, respectively, are fixed as possible resistance should buyers draw another breath today.
Support at 104.70 remains a watched level on the weekly timeframe, particularly after recently welcoming a 1% rebound. Supply at 108.16-106.88 also remains prominent from the weekly chart, capping upside since early August. Quasimodo support at 102.55 offers a feasible target beyond current support in the event we turn south, while removing supply draws the 2020 yearly opening value at 108.62 into the fight.
Last week shook hands with daily resistance at 106.06, a level mostly ignored since serving as support during May and June. Friday’s strong bearish presence clearly motivated additional bearish sentiment Monday, though failed to follow-through on Tuesday. Nevertheless, the weekly support level mentioned above at 104.70 is seen as the next downside target on this timeframe.
Areas of consideration:
A retest at October’s opening value from 105.42 (H4) is a potential intraday bullish scenario (red arrows), targeting 105.75/105.88. As you can probably see, the setup lacks higher timeframe confluence. For that reason, conservative buyers might seek (at least) additional H4 candlestick confirmation before pulling the trigger.
USD/CAD:
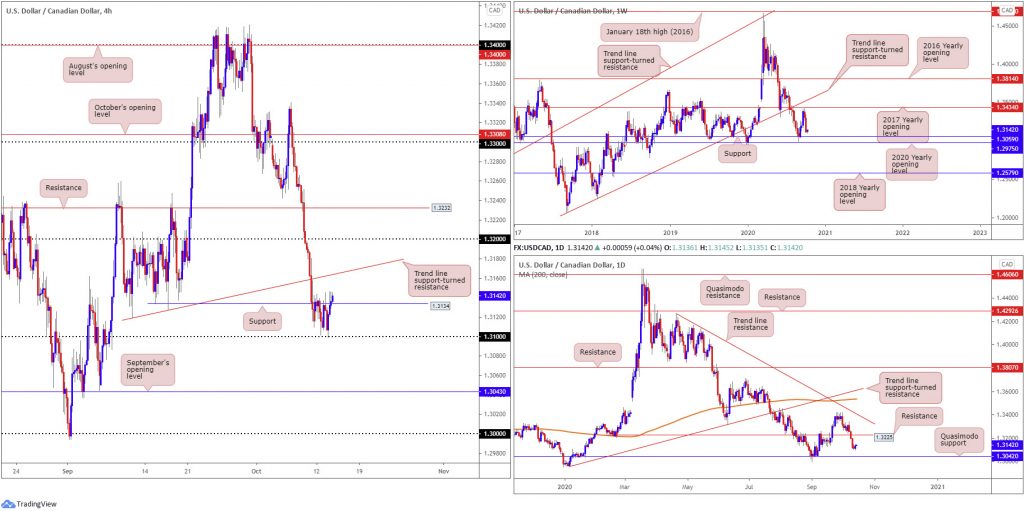
Aided on the back of the DXY’s stronger-than-expected rebound, 1.31 proved effective support Tuesday as buyers made their way above H4 resistance at 1.3134 (now potential support). Continued outperformance suggests we‘re likely to cross swords with trend line support-turned resistance, taken from the low 1.3119.
Technically, though, H4 buyers appear to be treading fragile ground. We can see both the weekly and daily timeframes reveal room to explore lower levels, with higher timeframe support unlikely to make an appearance until 1.3059 on the weekly timeframe, closely followed by daily Quasimodo support coming in at 1.3042.
Areas of consideration:
On account of the bigger picture favouring sellers, H4 buyers may lose interest should we connect with H4 trend line support-turned resistance, taken from the low 1.3119.
Ultimately, 1.3043 (September’s opening value), in addition to weekly support priced in at 1.3059 and the daily Quasimodo support at 1.3042, serves as a robust downside target for short positions. Equally, the area may also appeal to buyers.
The accuracy, completeness and timeliness of the information contained on this site cannot be guaranteed. IC Markets does not warranty, guarantee or make any representations, or assume any liability regarding financial results based on the use of the information in the site.
News, views, opinions, recommendations and other information obtained from sources outside of www.icmarkets.com.au, used in this site are believed to be reliable, but we cannot guarantee their accuracy or completeness. All such information is subject to change at any time without notice. IC Markets assumes no responsibility for the content of any linked site.
The fact that such links may exist does not indicate approval or endorsement of any material contained on any linked site. IC Markets is not liable for any harm caused by the transmission, through accessing the services or information on this site, of a computer virus, or other computer code or programming device that might be used to access, delete, damage, disable, disrupt or otherwise impede in any manner, the operation of the site or of any user’s software, hardware, data or property.
