
Key risk events today:
Australia GDP q/q; China Caixin Services PMI; UK Services PMI; Canada Trade Balance; UK Inflation Report Hearings; FOMC Members Williams, Bullard and Evans Speak; BOC Rate Statement and Overnight Rate.
EUR/USD:
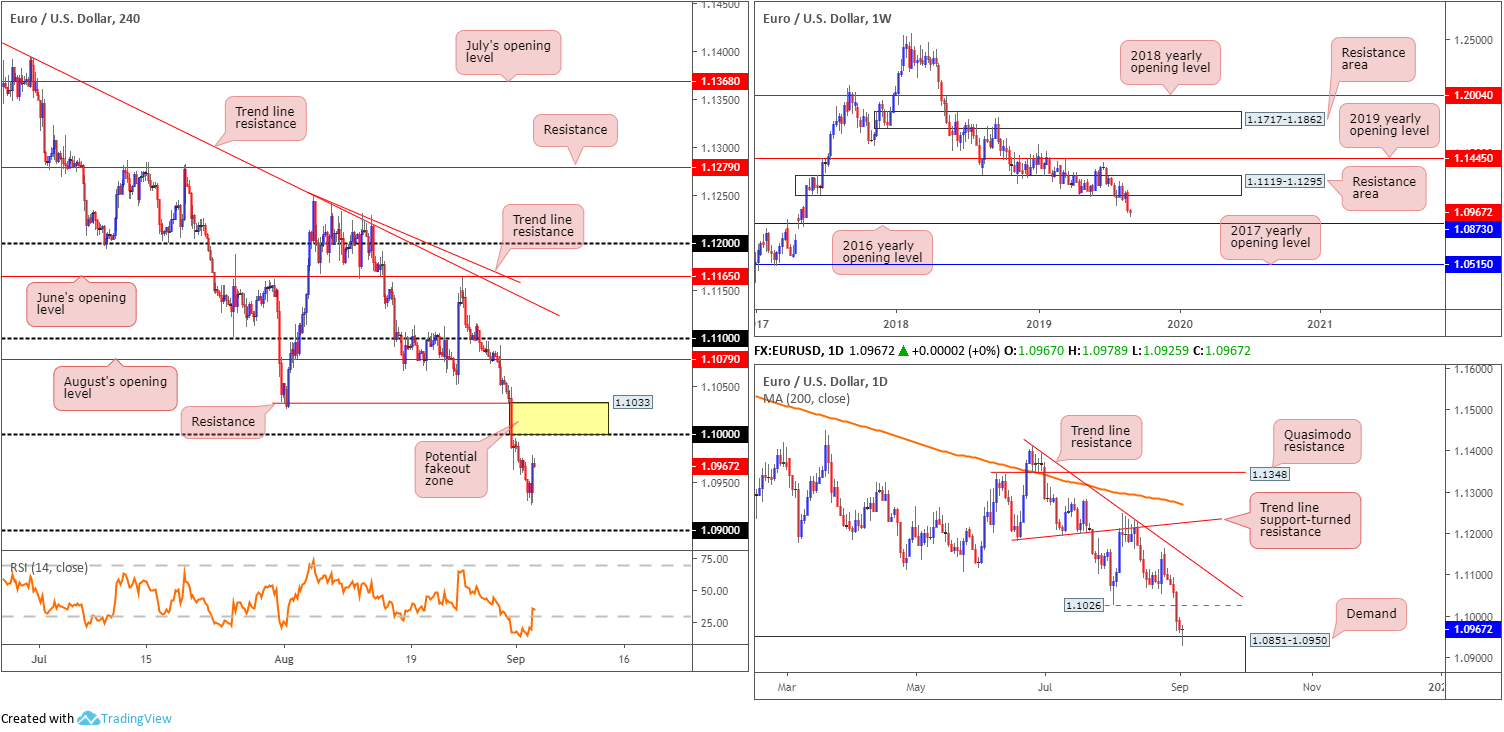
Europe’s single currency staged a modest recovery after clocking near 28-month lows versus the US dollar Wednesday. A sharp intraday turnaround in US Treasury bond yields, dismal US ISM Manufacturing PMI data and help from daily demand coming in at 1.0851-1.0950 (taken from April 2017) provided fresh impetus to the EUR/USD.
With daily buyers attempting to defend the said demand zone, an approach towards the underside of the key figure 1.10 on the H4 timeframe might be in the offing today. While this may be the case, a fakeout through 1.10 to H4 resistance at 1.1033 is also a strong possibility, given the next daily upside target from demand runs at 1.1026. Therefore, between 1.1033/1.10 on the H4 timeframe is labelled as a potential fakeout zone (yellow).
With respect to the weekly timeframe, after ripping through the lower edge of a long-standing demand area at 1.1119-1.1295 (now acting resistance zone), the next port of call in terms of support on this scale is the 2016 yearly opening level at 1.0873. Also clear from this timeframe is the trend. Since topping in early 2018, the long-term trend remains pointing in a southerly bearing.
Areas of consideration:
Although daily demand at 1.0851-1.0950 entered the mix yesterday, a retest of the 1.10 figure likely remains a key interest for sellers going forward, having noted weekly price exhibiting scope to run as far south as 1.0873. The only caveat here is the threat of a fakeout through 1.10 to as high as H4 resistance at 1.1033 (yellow zone).
To help avoid an unnecessary loss on a short at 1.10, traders are urged to consider waiting for additional H4 candlestick confirmation before pulling the trigger. This could be a shooting star pattern, a bearish outside formation or a bearish engulfing configuration etc. Not only will this help identify seller intent, it also provides entry and risk levels to work with.
GBP/USD:
The British pound concluded Tuesday a shade higher against the buck, recovering more than 140 points on the day from lows sub 1.20. Latest developments on the Brexit front observed the speaker of the House of Commons confirm the application for an emergency Brexit debate. Meanwhile, British Prime Minister Boris Johnson stated he would seek an early election, should rebel Tories continue to oppose an exit on October 31. The vote results of the No-Deal motion are expected to be released no later than 22.30BST/17.30ET, with rumours likely to be released before-hand.
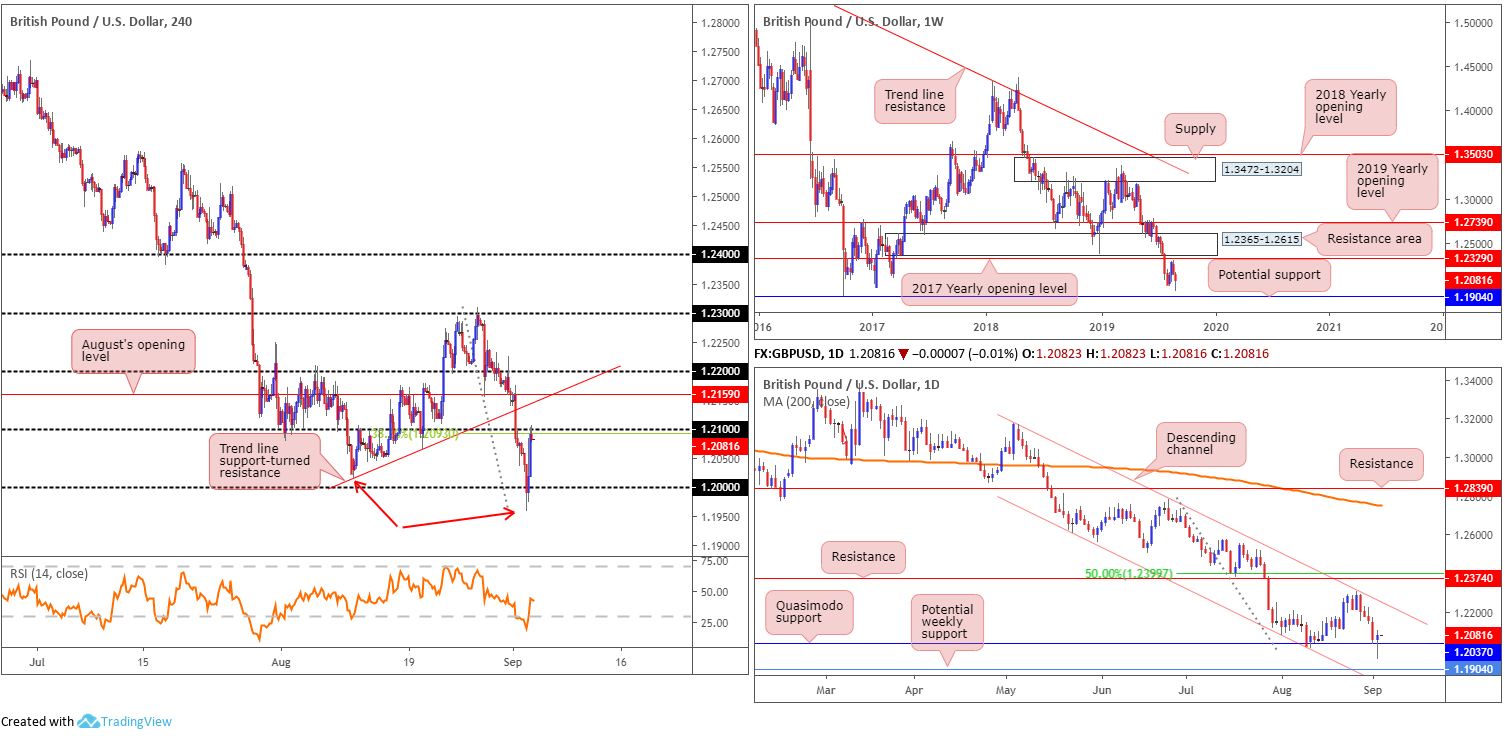
Technically speaking, early London witnessed the GBP/USD dip beneath key figure 1.20 on the H4 timeframe Tuesday, though despite clocking lows at 1.1958, its lowest level since October 2016, the pair staged an impressive recovery to 1.21, which happens to merge with a 38.2% Fibonacci resistance value at 1.2093.
Quasimodo support plotted on the daily timeframe at 1.2037 remains in the fold. Further upside has channel resistance (extended from the high 1.3176) to target, while beneath 1.2037 traders‘ crosshairs are likely pinned on potential weekly support drawn from 1.1904 – held price action strongly higher back in October 2016.
Areas of consideration:
Having printed fresh YTD lows (see red arrows on H4) yesterday, sellers are likely looking to short rallies. The H4 candles wrapped up the day at the underside of 1.21, which holds additional resistance in the form of a 38.2% Fibonacci ratio at 1.2093. A short from here, however, involves selling into probable buying from the daily Quasimodo support at 1.2037. Therefore, a move to August’s opening level at 1.2159 could also be in store, which combines with a H4 trend line support-turned resistance (taken from the low 1.2014).
Ultimately, the research team remains biased to the downside in this market, despite yesterday’s recovery. For that reason, today’s focus is on 1.21 and August’s opening level at 1.2159 for possible shorting opportunities.
AUD/USD:
In the early hours of Tuesday’s session, the commodity-linked currency tested waters sub 0.67, though swiftly recovered on the back of an upbeat tone out of the Reserve Bank of Australia (RBA). The central bank left rates unchanged at 1.0%, as expected. In its monetary policy, however, policy makers maintained guidance to ease the policy if needed to support sustainable growth, adding that looking forward, growth in Australia was expected to strengthen gradually.
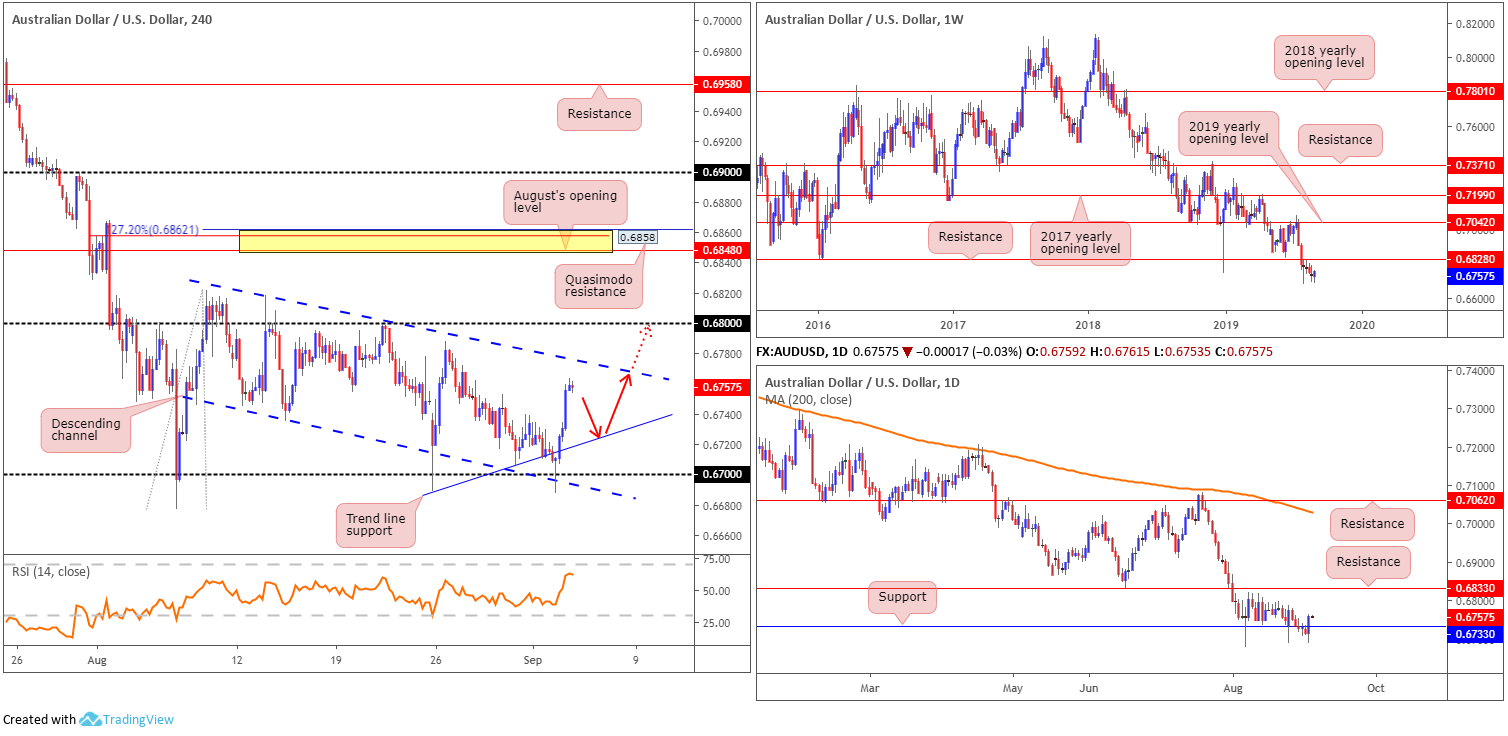
Further buying took hold following the release of dismal US ISM Manufacturing PMI data, eventually drawing the candles to a session high of 0.6763, a touch beneath H4 channel resistance (etched from the high 0.6818). Beyond here, traders are urged to take into account the round number 0.68. And beyond this psychological mark, a close-fitting area of resistance (yellow) also resides between a 127.2% Fibonacci ext. point at 0.6862, a Quasimodo resistance at 0.6858 and August’s opening level at 0.6848.
On a wider setting, daily price chalked up a clear-cut bullish outside day and closed north of support at 0.6733 yesterday. Limited supply is visible to the left of current price, potentially setting the stage for further buying today to resistance parked at 0.6833. In conjunction with daily structure, weekly flow displays room to approach/retest the underside of long-term resistance at 0.6828.
Areas of consideration:
With room for another wave of buying on the H4 timeframe to channel resistance (0.6818), daily price pencilling in a bullish outside day above support at 0.6733 and room to press higher on the weekly timeframe, today’s spotlight focuses on longs.
An ideal scenario would be for H4 action to pullback to trend line support extended from the low 0.6689, followed by a confirming bullish candlestick pattern (entry and risk levels can be structured according to this formation). As a reminder, upside targets can be found at channel resistance on the H4 timeframe, the round number 0.68 and weekly resistance at 0.6828, followed by daily resistance at 0.6833.
USD/JPY:
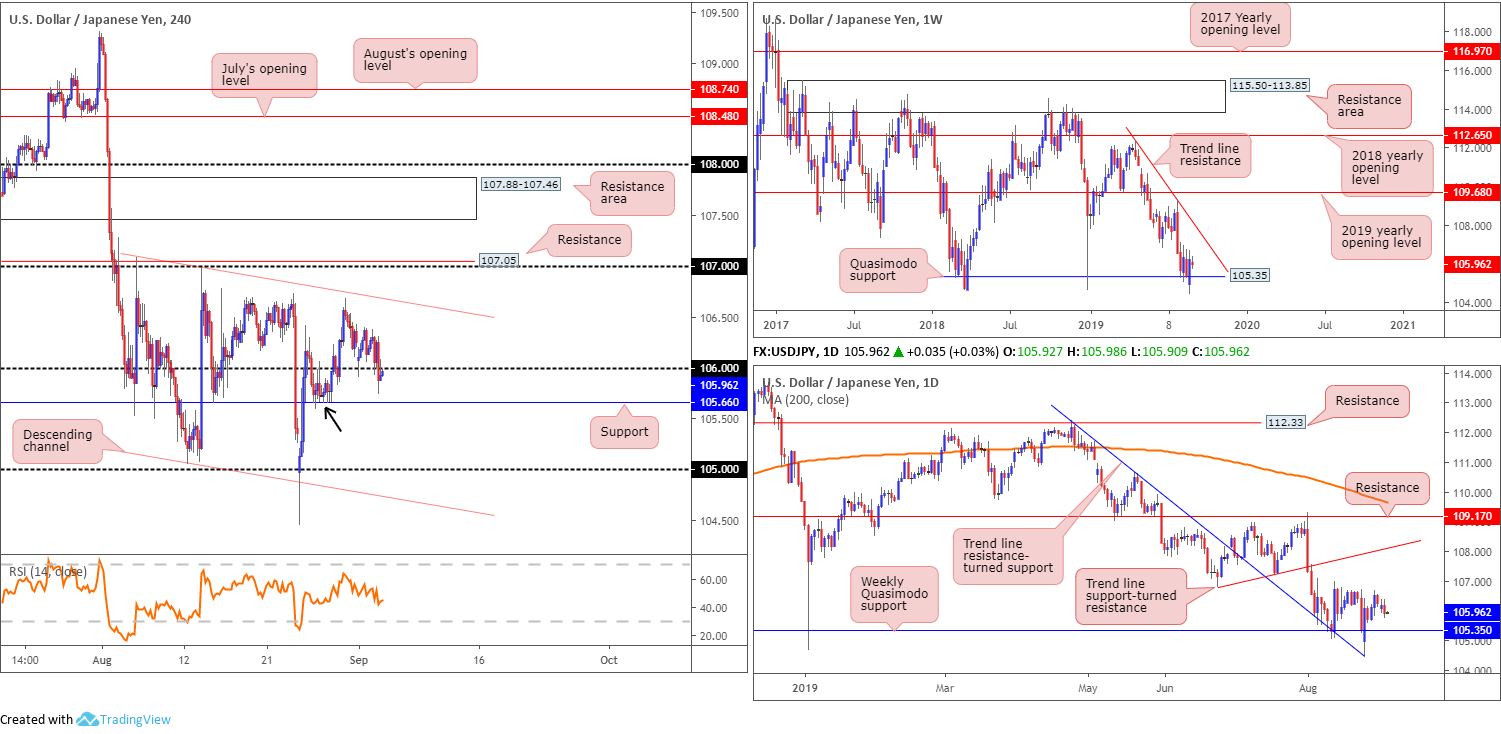
Disappointing US ISM Manufacturing PMI data prompted USD/JPY selling Tuesday, running orders at 106 on the H4 timeframe. With 106 likely to serve as resistance going forward, the next port of call in terms of support falls in at 105.66, followed by the 105 handle and then a channel support drawn from the low 105.05. Buying coming in from 105.66 is likely, having seen how well it served as support early last week (black arrow). Whether the bounce will be enough to reclaim 106+ status, though, is difficult to judge.
Elsewhere, weekly movement remains toying with Quasimodo support at 105.35 – a level that proved its worth by holding the unit higher at the beginning of the year. Outside of this base, limited support is evident until 100.61 (not visible on the screen), whereas a push north has trend line resistance (extended from the high 112.40) to target.
Recent action on the daily timeframe is consolidating north of the said weekly Quasimodo support and a trend line resistance-turned support (pencilled in from the high 112.40) on the daily. Tops set at 106.77 remain the next upside objective on this scale, followed by trend line support-turned resistance (taken from the low 106.78).
Areas of consideration:
Although lacking oomph at the moment, higher-timeframe structure emphasises support. As such, a test of 105.66 today followed by a H4 close above 106 is a bullish indicator, with an initial upside target set at H4 channel resistance (extended from the high 107.09). While several entry techniques are likely to be used, two of the basics remain buying the breakout candle above 106 with protective stop-loss orders plotted below its lower shadow, or waiting for a retest at 106 to unfold and entering on the rejecting candle’s structure.
The accuracy, completeness and timeliness of the information contained on this site cannot be guaranteed. IC Markets does not warranty, guarantee or make any representations, or assume any liability regarding financial results based on the use of the information in the site.
News, views, opinions, recommendations and other information obtained from sources outside of www.icmarkets.com.au, used in this site are believed to be reliable, but we cannot guarantee their accuracy or completeness. All such information is subject to change at any time without notice. IC Markets assumes no responsibility for the content of any linked site.
The fact that such links may exist does not indicate approval or endorsement of any material contained on any linked site. IC Markets is not liable for any harm caused by the transmission, through accessing the services or information on this site, of a computer virus, or other computer code or programming device that might be used to access, delete, damage, disable, disrupt or otherwise impede in any manner, the operation of the site or of any user’s software, hardware, data or property.